


Study the bar graph and answer the questions given below:
What was the percentage increase in the production of oil from 2009 to 2010?

A. \[10\%\]
B. \[15\%\]
C. \[20\%\]
D. \[25\%\]
Answer
516.6k+ views
Hint: In this problem, we have to find the percentage increase in the production of oil from 2009 to 2010 from the given graph. Here we can first analyse the given graph, where we have an increased value from 40 to 50 in the year 2009 to 2010. We can now find the difference between them and divide them by the total, we can then multiply the resulting value by 100 to get the required percentage.
Complete step by step answer:
Here we have to find the percentage increase in the production of oil from 2009 to 2010.
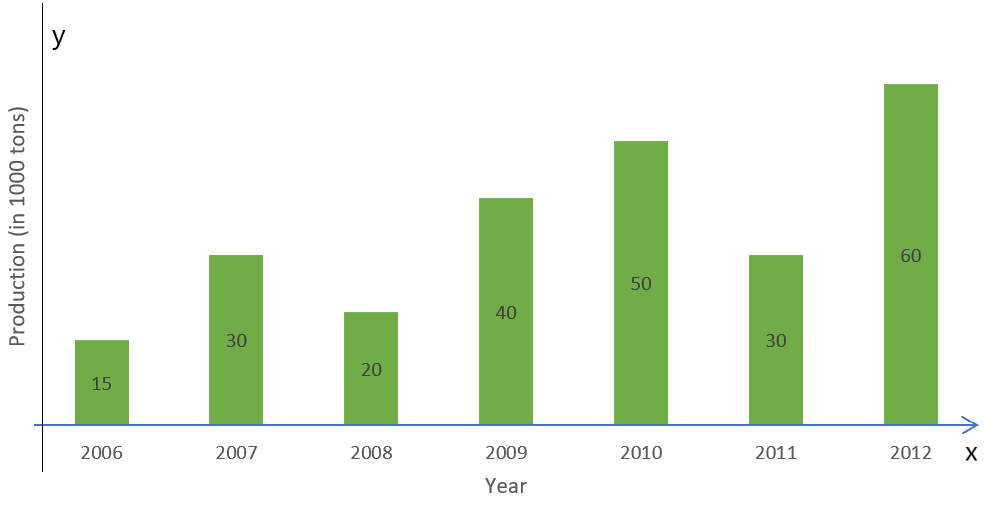
We can see that from the given diagram, the production of oil has increased from 40 to 50 in the years 2009 to 2010. We can now find the percentage by finding their difference and multiplying it with 100, we get
\[\Rightarrow \dfrac{50-40}{40}\times 100\%\]
We can now simplify the above step, we get
\[\Rightarrow \dfrac{1000}{40}=\dfrac{100}{4}=25\%\]
There will be an increase of \[25\%\] production of oil from the year 2009 to 2010.
So, the correct answer is “Option D”.
Note: We should always remember that we should analyse the given graph for the data to be collected which is required to find the answer. We can find the percentage value by multiplying the resulting value by 100, where the resulting value is the difference between the given two values, which is divided by the initial value.
Complete step by step answer:
Here we have to find the percentage increase in the production of oil from 2009 to 2010.
We can see that from the given diagram, the production of oil has increased from 40 to 50 in the years 2009 to 2010. We can now find the percentage by finding their difference and multiplying it with 100, we get
\[\Rightarrow \dfrac{50-40}{40}\times 100\%\]
We can now simplify the above step, we get
\[\Rightarrow \dfrac{1000}{40}=\dfrac{100}{4}=25\%\]
There will be an increase of \[25\%\] production of oil from the year 2009 to 2010.
So, the correct answer is “Option D”.
Note: We should always remember that we should analyse the given graph for the data to be collected which is required to find the answer. We can find the percentage value by multiplying the resulting value by 100, where the resulting value is the difference between the given two values, which is divided by the initial value.
Recently Updated Pages
Master Class 9 General Knowledge: Engaging Questions & Answers for Success
Master Class 9 Social Science: Engaging Questions & Answers for Success
Master Class 9 English: Engaging Questions & Answers for Success
Master Class 9 Maths: Engaging Questions & Answers for Success
Master Class 9 Science: Engaging Questions & Answers for Success
Class 9 Question and Answer - Your Ultimate Solutions Guide
Trending doubts
Difference Between Plant Cell and Animal Cell
Fill the blanks with the suitable prepositions 1 The class 9 english CBSE
Who is eligible for RTE class 9 social science CBSE
Which places in India experience sunrise first and class 9 social science CBSE
What is pollution? How many types of pollution? Define it
Name 10 Living and Non living things class 9 biology CBSE