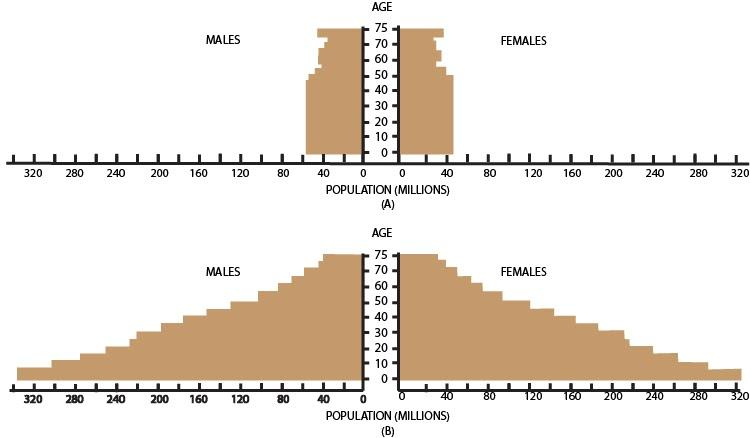
The age-sex structure of a population can be depicted in the form of a pyramid by plotting the percentage of the population of each sex in each age class. Two age-sex pyramids are given here.
Study carefully the above age-sex pyramids and select the correct statements regarding these.

(a) A represents the age-sex pyramid for a developed country and B represents the age-sex pyramid for a developing country.
(b) B is a much less steep pyramid, representing a rapidly growing population, like that of India, as it has a much larger number of young people.
(c) A is a steeper pyramid, which represents a nearly stable population.
(d) All of these.

Answer
521.4k+ views
Hint: Age-sex ratio is the attribute of a population. An individual can either be male or female with varying ages. It is a ratio of males and females to their age in a population. These attributes are helpful in measuring the population.
Complete answer:
Sex ratio means the number of females/1000 males. By this ratio, the number of males and females per age group can be obtained. Although, the ratio may vary based on various factors. The pattern of the population differs by the age-sex ratio, the higher the population the lower will be the age group, and as the age increases the population size decreases.
Graph A shows the age-sex pyramid for a developed country showing a steeper graph with constant and stable growth. While graph B shows the age-sex pyramid for a developing country showing rapid population growth. The pyramid is less steep with more number of younger people.
Additional information:
The age-sex ratio varies differs in each population. So, it is better to study different ratios for different populations.
This age-sex ratio is an important source of information that acts as a social indicator and measures the number of males and females ratio according to t the different age groups and also measures their stability.
The sex ratio in India is observed to be decreasing as the age of the individual increases.
The population is not stable in developing countries like India due to various factors.
So, the correct answer is ‘All of these these’.
Note:
The age-sex pyramids are generally of three types: expansive pyramid (The population pyramids representing the larger number of younger people. As the age group increases the size of their population decreases), constrictive pyramids (The population pyramids representing the lower number of younger people.), and stationary pyramids (The population pyramids representing the equal number of all age groups).
Recently Updated Pages
Master Class 12 Economics: Engaging Questions & Answers for Success

Master Class 12 Physics: Engaging Questions & Answers for Success

Master Class 12 English: Engaging Questions & Answers for Success

Master Class 12 Social Science: Engaging Questions & Answers for Success

Master Class 12 Maths: Engaging Questions & Answers for Success

Master Class 12 Business Studies: Engaging Questions & Answers for Success

Trending doubts
Which are the Top 10 Largest Countries of the World?

What are the major means of transport Explain each class 12 social science CBSE

Draw a labelled sketch of the human eye class 12 physics CBSE

Why cannot DNA pass through cell membranes class 12 biology CBSE

Differentiate between insitu conservation and exsitu class 12 biology CBSE

Draw a neat and well labeled diagram of TS of ovary class 12 biology CBSE


