


The annual profits earned by \[30\] shops of a shopping complex in a locality give rise to the following distributions:
Profit (in lakh Rs.) Number of shops (frequency) More than or equal to \[5\] \[30\] More than or equal to \[10\] \[28\] More than or equal to \[15\] \[16\] More than or equal to \[20\] \[14\] More than or equal to \[25\] \[10\] More than or equal to \[30\] \[7\] More than or equal to \[35\] \[3\]
Draw both ogives for the data given and hence obtain the median profit.
| Profit (in lakh Rs.) | Number of shops (frequency) |
| More than or equal to \[5\] | \[30\] |
| More than or equal to \[10\] | \[28\] |
| More than or equal to \[15\] | \[16\] |
| More than or equal to \[20\] | \[14\] |
| More than or equal to \[25\] | \[10\] |
| More than or equal to \[30\] | \[7\] |
| More than or equal to \[35\] | \[3\] |
Answer
517.5k+ views
Hint: In order to draw the ogive graph, we will need to obtain cumulative frequency. First, we will have to obtain the frequency distribution from the given data. Then we will create the less than frequency distribution.
Finally, we will plot More than and Less than frequency distribution on chat and their point of intersection will be the median.
Complete step by step solution:
We are given the distribution for the annual profit of the number of shops (frequency).
First, we will create the frequency distribution table. We can see that more than frequency distribution has an interval of five. It will give us the following result:
Now we can create Less than frequency distribution easily as follows:
Now we can draw the ogive graph. Profit is taken on \[X - axis\] and number of shops on \[Y - axis\]. Thus, for More than graph, the points to be plotted will be: \[(5,30),(10,28),(15,16),(20,14),(25,10),(30,7),(35,3)\]
For Less than type it will be: \[(10,2),(15,14),(20,16),(25,20),(30,23),(35,27),(40,30)\]
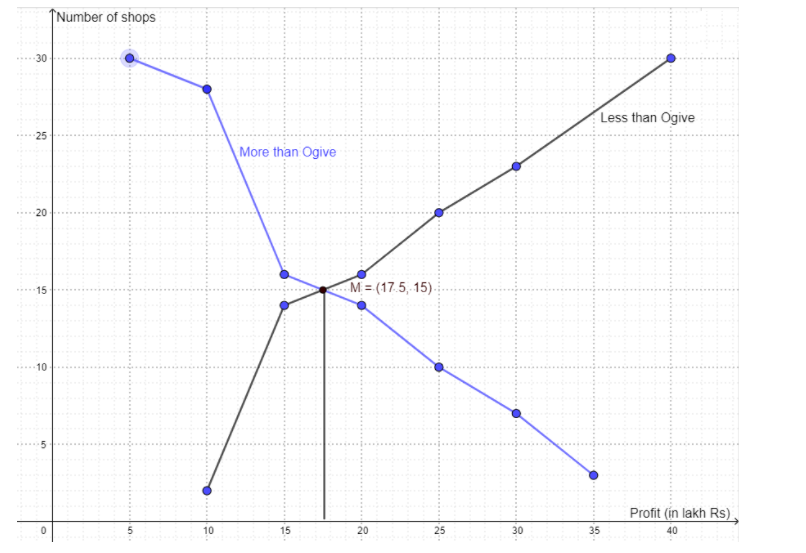
We can see from the graph that they intersect at point \[M(17.5,15)\].
So, we can conclude that the median profit will be Rs. \[17.5\] lakhs.
Note: The frequency distribution graph of a series is known as the Ogive. The Ogive is a cumulative distribution graph that illustrates data values on the horizontal plane and cumulative relative frequencies, cumulative frequencies, or cumulative percent frequencies on the vertical axis.
Finally, we will plot More than and Less than frequency distribution on chat and their point of intersection will be the median.
Complete step by step solution:
We are given the distribution for the annual profit of the number of shops (frequency).
| Profit (in lakh Rs.) | Number of shops (frequency) |
| More than or equal to \[5\] | \[30\] |
| More than or equal to \[10\] | \[28\] |
| More than or equal to \[15\] | \[16\] |
| More than or equal to \[20\] | \[14\] |
| More than or equal to \[25\] | \[10\] |
| More than or equal to \[30\] | \[7\] |
| More than or equal to \[35\] | \[3\] |
First, we will create the frequency distribution table. We can see that more than frequency distribution has an interval of five. It will give us the following result:
| Profit (in lakh Rs.) | Number of shops (frequency) |
| \[5 - 10\] | \[30 - 28 = 2\] |
| \[10 - 15\] | \[28 - 16 = 12\] |
| \[15 - 20\] | \[16 - 14 = 2\] |
| \[20 - 25\] | \[14 - 10 = 4\] |
| \[25 - 30\] | \[10 - 7 = 3\] |
| \[30 - 35\] | \[7 - 3 = 4\] |
| \[35 - 40\] | \[3\] |
| \[\sum {f_i} = 30\] |
Now we can create Less than frequency distribution easily as follows:
| Profit (in lakh Rs.) | Number of shops (frequency) |
| Less than or equal to \[5\] | \[2\] |
| Less than or equal to \[10\] | \[2 + 12 = 14\] |
| Less than or equal to \[15\] | \[14 + 2 = 16\] |
| Less than or equal to \[20\] | \[16 + 4 = 20\] |
| Less than or equal to \[25\] | \[20 + 3 = 23\] |
| Less than or equal to \[30\] | \[23 + 4 = 27\] |
| Less than or equal to \[35\] | \[27 + 3 = 30\] |
Now we can draw the ogive graph. Profit is taken on \[X - axis\] and number of shops on \[Y - axis\]. Thus, for More than graph, the points to be plotted will be: \[(5,30),(10,28),(15,16),(20,14),(25,10),(30,7),(35,3)\]
For Less than type it will be: \[(10,2),(15,14),(20,16),(25,20),(30,23),(35,27),(40,30)\]
We can see from the graph that they intersect at point \[M(17.5,15)\].
So, we can conclude that the median profit will be Rs. \[17.5\] lakhs.
Note: The frequency distribution graph of a series is known as the Ogive. The Ogive is a cumulative distribution graph that illustrates data values on the horizontal plane and cumulative relative frequencies, cumulative frequencies, or cumulative percent frequencies on the vertical axis.
Recently Updated Pages
Master Class 9 General Knowledge: Engaging Questions & Answers for Success
Master Class 9 Social Science: Engaging Questions & Answers for Success
Master Class 9 English: Engaging Questions & Answers for Success
Master Class 9 Maths: Engaging Questions & Answers for Success
Master Class 9 Science: Engaging Questions & Answers for Success
Class 9 Question and Answer - Your Ultimate Solutions Guide
Trending doubts
Difference Between Plant Cell and Animal Cell
Fill the blanks with the suitable prepositions 1 The class 9 english CBSE
Who is eligible for RTE class 9 social science CBSE
Which places in India experience sunrise first and class 9 social science CBSE
What is pollution? How many types of pollution? Define it
Name 10 Living and Non living things class 9 biology CBSE