


The area under the acceleration-time graph gives:
A.) Distance travelled
B.) Change in direction
C.) Force acting
D.) Change in velocity
Answer
603.6k+ views
Hint: Try to understand the concept of graphs between two physical quantities. Draw an acceleration-time graph. Try to find the area of the graph with the help of physical notations. Then we can find our answer.
Complete step by step answer:
An acceleration-time graph is represented as the acceleration on the y-axis or the vertical axis and time in the x-axis or the horizontal axis. The value of the graph at a particular time will give us the acceleration of the object at that point of time.
Slope of an acceleration-time graph is known as a jerk. It gives us the rate of change of acceleration.
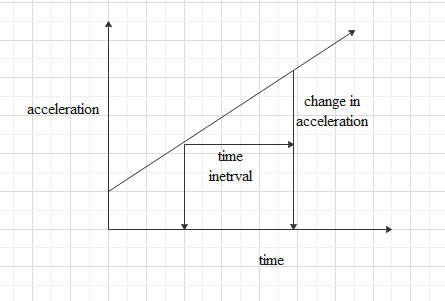
We can find the area under the acceleration-time graph for a certain time interval.
Area under the graph can be defined as, $\text{area }=\Delta a\times \Delta t$
Where, $\Delta t$ is the time interval and $\Delta a$ the change in acceleration in that time interval.
Now we can find acceleration as,
$\Delta a=\dfrac{\Delta v}{\Delta t}$
So, by multiplying both sides of equation by $\Delta t$ , we can write,
$\Delta a\times \Delta t=\Delta v$
So, the area under the acceleration-time graph can be given as,
$\text{area }=\Delta a\times \Delta t=\Delta v$
Which is the rate of change of velocity.
So, the area under any acceleration time graph at a certain time interval will give us the rate of change of velocity.
The correct option is (a).
Note: For a constant acceleration we will get a linear graph parallel to the time axis. If we have a uniformly increasing acceleration, we will get a straight line with a slope. For non-uniform acceleration we won’t get a straight-line graph.
Complete step by step answer:
An acceleration-time graph is represented as the acceleration on the y-axis or the vertical axis and time in the x-axis or the horizontal axis. The value of the graph at a particular time will give us the acceleration of the object at that point of time.
Slope of an acceleration-time graph is known as a jerk. It gives us the rate of change of acceleration.
We can find the area under the acceleration-time graph for a certain time interval.
Area under the graph can be defined as, $\text{area }=\Delta a\times \Delta t$
Where, $\Delta t$ is the time interval and $\Delta a$ the change in acceleration in that time interval.
Now we can find acceleration as,
$\Delta a=\dfrac{\Delta v}{\Delta t}$
So, by multiplying both sides of equation by $\Delta t$ , we can write,
$\Delta a\times \Delta t=\Delta v$
So, the area under the acceleration-time graph can be given as,
$\text{area }=\Delta a\times \Delta t=\Delta v$
Which is the rate of change of velocity.
So, the area under any acceleration time graph at a certain time interval will give us the rate of change of velocity.
The correct option is (a).
Note: For a constant acceleration we will get a linear graph parallel to the time axis. If we have a uniformly increasing acceleration, we will get a straight line with a slope. For non-uniform acceleration we won’t get a straight-line graph.
Recently Updated Pages
Master Class 11 Computer Science: Engaging Questions & Answers for Success
Master Class 11 Business Studies: Engaging Questions & Answers for Success
Master Class 11 Economics: Engaging Questions & Answers for Success
Master Class 11 English: Engaging Questions & Answers for Success
Master Class 11 Maths: Engaging Questions & Answers for Success
Master Class 11 Biology: Engaging Questions & Answers for Success
Trending doubts
One Metric ton is equal to kg A 10000 B 1000 C 100 class 11 physics CBSE
There are 720 permutations of the digits 1 2 3 4 5 class 11 maths CBSE
Discuss the various forms of bacteria class 11 biology CBSE
Draw a diagram of a plant cell and label at least eight class 11 biology CBSE
State the laws of reflection of light
Explain zero factorial class 11 maths CBSE