


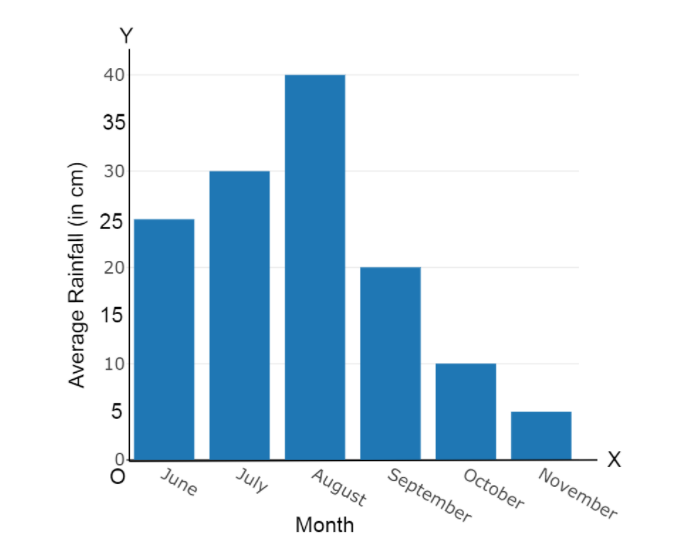
The data given below shows the average rainfall in Udaipur from June to November of a certain year. Draw a bar graph to represent this information.
Month June July Aug. Sep. Oct. Nov. Average rainfall 25 cm 30 cm 40 cm 20 cm 10 cm 5 cm
| Month | June | July | Aug. | Sep. | Oct. | Nov. |
| Average rainfall | 25 cm | 30 cm | 40 cm | 20 cm | 10 cm | 5 cm |
Answer
478.2k+ views
Hint:In the above given problem, we are given the data for the average rainfall in the city of Udaipur from the month of June to November of a certain year. We have to show the graphical representation of the given data of average rainfall through a bar graph. In order to approach the solution, we can take two axes as the X-axis and the Y-axis respectively, to show the months on the X-axis and the Average Rainfall (in centimetres) on the Y-axis respectively.
Complete step by step answer:
We can draw the required bar graph following these small steps.First, take two axes as the X and Y axes, on the XY plane with the origin O.Write the names of the months along the X-axis at uniform distances.On the Y-axis, take the scale of one big division equal to 5 centimetres.Then the heights of each bar will be equivalent to: 5 big divisions, 6 big divisions, 8 big divisions, 4 big divisions, 2 big divisions, and 1 big division respectively.
Now, on the X-axis, draw the bars of equal width and heights obtained above, with respect to each month pointed on the axis.Therefore, following the above written steps will obtain us the required bar graph.The graphical representation of the average rainfall in the months from June to November in Udaipur is shown by the bar graph given below.
Note:A bar graph can be defined as a chart or a graphical representation of data, quantities or numbers using bars or strips. Bar graphs are used to compare and contrast numbers, frequencies or other measures of distinct categories of data. A bar graph is a chart that plots data using rectangular bars or columns (called bins) that represent the total amount of observations in the data for that category. Bar graphs are commonly used in financial analysis for displaying data. A stock volume chart is a commonly used type of vertical bar graph.
Recently Updated Pages
Master Class 12 Economics: Engaging Questions & Answers for Success
Master Class 12 Physics: Engaging Questions & Answers for Success
Master Class 12 English: Engaging Questions & Answers for Success
Master Class 12 Social Science: Engaging Questions & Answers for Success
Master Class 12 Maths: Engaging Questions & Answers for Success
Master Class 12 Business Studies: Engaging Questions & Answers for Success
Trending doubts
Which are the Top 10 Largest Countries of the World?
What are the major means of transport Explain each class 12 social science CBSE
Draw a labelled sketch of the human eye class 12 physics CBSE
Why cannot DNA pass through cell membranes class 12 biology CBSE
Differentiate between insitu conservation and exsitu class 12 biology CBSE
Draw a neat and well labeled diagram of TS of ovary class 12 biology CBSE