


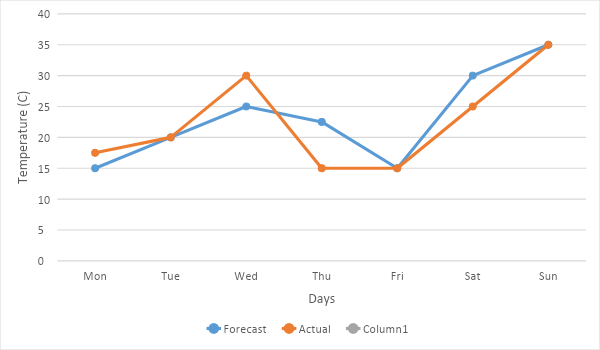
The following graph shows the temperature forecast and the actual temperature of a week.
(a) On which day was the forecast temperature the same as the actual temperature?
(b) What was the maximum forecast temperature during the week?
(c) What was the minimum actual temperature during the week?
(d) On which day did the actual temperature differ the most from the forecast temperature?
Answer
579k+ views
Hint: To find the comparison between the two lines we can easily compare the values that these lines inscribe on a particular day. Forecast temperature is just a prediction of the future temperature using high-end technologies. The lesser the difference between the actual and forecast temperature more is the accuracy of the forecasting technology.
Complete step-by-step answer:
(a)The forecast temperature and the actual temperature were the same on 3 of the 7 days, thus indicating a relatively high accuracy in forecasting. The days when the actual and forecast temperatures were the same are Tuesday, Friday and Sunday.
(b) The forecast temperature reached a peak on Sunday, where the forecasted temperature was about \[{35^ \circ }C\].
(c) The minimum actual temperature during the week was \[{15^ \circ }C\], which occurred on 2 consecutive days, Thursday and Friday.
(d) The maximum difference in the actual temperature and the forecasted temperature was on Thursday, where the difference between the two temperatures was about \[{7.5^ \circ }C\].
Note: We can also answer all these questions by simply observing the graph, rather than observing the value. When the line of either actual or forecasted temperature reaches a maximum point, that point will be the maximum temperature of its type. And whenever the two lines intersect at a common point on a single day, then at that day the actual and the forecasted temperature will be the same.
Recently Updated Pages
Master Class 10 Computer Science: Engaging Questions & Answers for Success
Master Class 10 General Knowledge: Engaging Questions & Answers for Success
Master Class 10 English: Engaging Questions & Answers for Success
Master Class 10 Social Science: Engaging Questions & Answers for Success
Master Class 10 Maths: Engaging Questions & Answers for Success
Master Class 10 Science: Engaging Questions & Answers for Success
Trending doubts
What is the median of the first 10 natural numbers class 10 maths CBSE
Which women's tennis player has 24 Grand Slam singles titles?
Who is the Brand Ambassador of Incredible India?
Why is there a time difference of about 5 hours between class 10 social science CBSE
Write a letter to the principal requesting him to grant class 10 english CBSE
A moving boat is observed from the top of a 150 m high class 10 maths CBSE