
The following table shows a record from a hospital of 84 number of casualties due to accidents of different age groups.
Age 5 – 15 15 – 25 25 – 35 35 – 45 45 – 55 55 – 65 65 – 75 No. of casualties 6 10 15 13 25 8 7
Taking a scale of 2 cm \[ = \] 10 years on one axis and 2 cm \[ = \] 10 casualties on the other, draw an ogive and estimate:
(a) the median.
(b) the upper quartile.
(c) the number of casualties above age 57 years.
| Age | 5 – 15 | 15 – 25 | 25 – 35 | 35 – 45 | 45 – 55 | 55 – 65 | 65 – 75 |
| No. of casualties | 6 | 10 | 15 | 13 | 25 | 8 | 7 |
Answer
572.7k+ views
Hint:
Here, we need to draw an ogive and find the required data. First, we will convert the exclusive series into a less than type series using cumulative frequencies. Using the less than type series, and taking the age on \[x\]-axis and number of casualties on \[y\]-axis, we will plot the points and join them to get the required ogive. Finally, we will find the required data by drawing straight lines from the axes to the ogive.
Complete step by step solution:
The given table shows an exclusive series, not an inclusive series. Therefore, we do not need to convert it first.
We will create a less than ogive table, using cumulative frequencies.
For example, “Less than 25” will include frequencies of both the class intervals \[5 - 15\] and \[15 - 25\].
Similarly, we will convert the rest of the class intervals into less than type using cumulative frequencies.
Finally, we will use the age on \[x\]-axis and number of casualties on \[y\]-axis to draw the less than ogive.
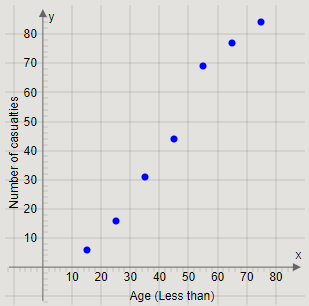
Plotting the points \[\left( {15,6} \right),\left( {25,16} \right),\left( {35,31} \right),\left( {45,44} \right),\left( {55,69} \right),\left( {65,77} \right),\left( {75,84} \right)\], we get the graph
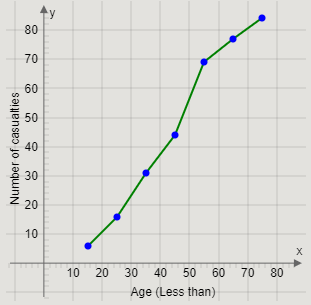
Joining the pairs of two successive points, we get the curve
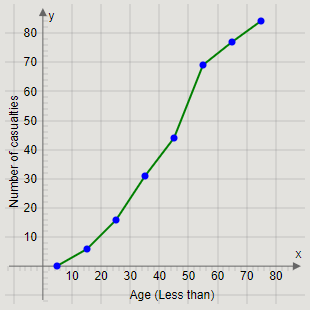
We will now create an interval “Less than 5” before the first interval, with frequency 0.
Thus, plotting the point
\[\left( {5,0} \right)\] and joining it with \[\left( {15,6} \right)\], we get the required ogive as
(a)
We will find the median using the ogive.
The median is the \[{\left( {\dfrac{N}{2}} \right)^{th}}\] term.
The total number of casualties is 84.
Therefore, we get
\[\dfrac{N}{2} = \dfrac{{84}}{2} = 42\]
From the point \[\left( {0,42} \right)\] on the cumulative frequency axis, we will draw a straight line towards the ogive.
Then, from the point on the ogive, we will draw a straight line towards the Age axis.
The age at which the straight line touches the age axis is the median age of casualties.
Therefore, we get the graph
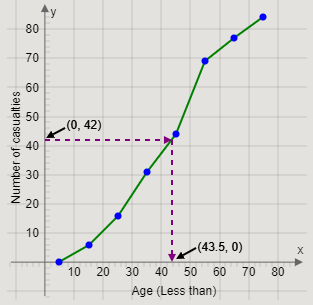
Thus, the median age is approximately \[43.5\] years.
(b)
We will find the upper quartile using the ogive.
The upper quartile is the \[{\left( {\dfrac{{3N}}{4}} \right)^{th}}\] term.
The total number of casualties is 84.
Therefore, we get
\[\dfrac{{3N}}{4} = \dfrac{{3 \times 84}}{4} = 3 \times 21 = 63\]
From the point \[\left( {0,63} \right)\] on the cumulative frequency axis, we will draw a straight line towards the ogive.
Then, from the point on the ogive, we will draw a straight line towards the Age axis.
The age at which the straight line touches the age axis is the upper quartile.
Therefore, we get the graph
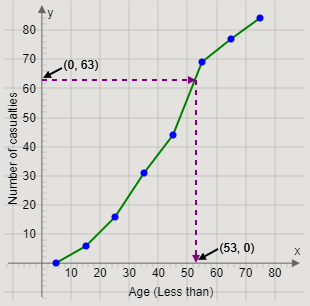
Thus, the upper quartile is approximately 53 years.
(c)
The number of casualties above the age of 57 years is the difference in the total number of casualties and the number of casualties less than 57 years of age.
We will use the ogive to find the number of casualties less than 57 years of age.
From the point \[\left( {57,0} \right)\] on the age axis, we will draw a straight line towards the ogive.
Then, from the point on the ogive, we will draw a straight line towards the cumulative frequency axis.
The cumulative frequency at which the straight line touches the cumulative frequency axis is the number of casualties less than 57 years of age.
Therefore, we get the graph
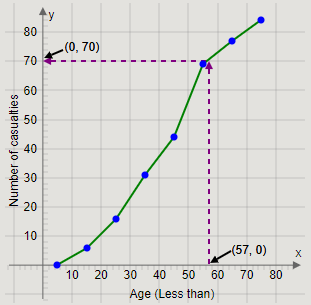
Thus, the number of casualties less than the age of 57 years is approximately 70.
Therefore, we get
Number of casualties above the age of 57 years \[ = 84 - 70 = 14\]
Thus, the number of casualties above 57 years of age is 14 casualties.
Note:
We have used the terms ‘exclusive series’ and ‘inclusive series’ in the solution.
An inclusive series is that series where the class intervals include both upper and lower limits. For example: In the given inclusive series, 10 – 19 includes all the numbers between 10 and 19 along with 10 and 19 also.
An exclusive series is that series where the class intervals include both upper and lower limits. We know that in an exclusive series, the upper limit of a class interval is equal to the lower limit of the next class interval. For example: In the exclusive series, \[9.5\] – \[19.5\] includes all the numbers between \[9.5\] and \[19.5\], including \[9.5\] but not \[19.5\].
It is important to convert an inclusive series into an exclusive series before making the less than or more than series.
Here, we need to draw an ogive and find the required data. First, we will convert the exclusive series into a less than type series using cumulative frequencies. Using the less than type series, and taking the age on \[x\]-axis and number of casualties on \[y\]-axis, we will plot the points and join them to get the required ogive. Finally, we will find the required data by drawing straight lines from the axes to the ogive.
Complete step by step solution:
The given table shows an exclusive series, not an inclusive series. Therefore, we do not need to convert it first.
We will create a less than ogive table, using cumulative frequencies.
For example, “Less than 25” will include frequencies of both the class intervals \[5 - 15\] and \[15 - 25\].
Similarly, we will convert the rest of the class intervals into less than type using cumulative frequencies.
| Age | Less than 15 | Less than 25 | Less than 35 | Less than 45 | Less than 55 | Less than 65 | Less than 75 |
| No. of Lessons | 6 | 16 | 31 | 44 | 69 | 77 | 84 |
Finally, we will use the age on \[x\]-axis and number of casualties on \[y\]-axis to draw the less than ogive.
Plotting the points \[\left( {15,6} \right),\left( {25,16} \right),\left( {35,31} \right),\left( {45,44} \right),\left( {55,69} \right),\left( {65,77} \right),\left( {75,84} \right)\], we get the graph

Joining the pairs of two successive points, we get the curve

We will now create an interval “Less than 5” before the first interval, with frequency 0.
Thus, plotting the point
\[\left( {5,0} \right)\] and joining it with \[\left( {15,6} \right)\], we get the required ogive as

(a)
We will find the median using the ogive.
The median is the \[{\left( {\dfrac{N}{2}} \right)^{th}}\] term.
The total number of casualties is 84.
Therefore, we get
\[\dfrac{N}{2} = \dfrac{{84}}{2} = 42\]
From the point \[\left( {0,42} \right)\] on the cumulative frequency axis, we will draw a straight line towards the ogive.
Then, from the point on the ogive, we will draw a straight line towards the Age axis.
The age at which the straight line touches the age axis is the median age of casualties.
Therefore, we get the graph

Thus, the median age is approximately \[43.5\] years.
(b)
We will find the upper quartile using the ogive.
The upper quartile is the \[{\left( {\dfrac{{3N}}{4}} \right)^{th}}\] term.
The total number of casualties is 84.
Therefore, we get
\[\dfrac{{3N}}{4} = \dfrac{{3 \times 84}}{4} = 3 \times 21 = 63\]
From the point \[\left( {0,63} \right)\] on the cumulative frequency axis, we will draw a straight line towards the ogive.
Then, from the point on the ogive, we will draw a straight line towards the Age axis.
The age at which the straight line touches the age axis is the upper quartile.
Therefore, we get the graph

Thus, the upper quartile is approximately 53 years.
(c)
The number of casualties above the age of 57 years is the difference in the total number of casualties and the number of casualties less than 57 years of age.
We will use the ogive to find the number of casualties less than 57 years of age.
From the point \[\left( {57,0} \right)\] on the age axis, we will draw a straight line towards the ogive.
Then, from the point on the ogive, we will draw a straight line towards the cumulative frequency axis.
The cumulative frequency at which the straight line touches the cumulative frequency axis is the number of casualties less than 57 years of age.
Therefore, we get the graph

Thus, the number of casualties less than the age of 57 years is approximately 70.
Therefore, we get
Number of casualties above the age of 57 years \[ = 84 - 70 = 14\]
Thus, the number of casualties above 57 years of age is 14 casualties.
Note:
We have used the terms ‘exclusive series’ and ‘inclusive series’ in the solution.
An inclusive series is that series where the class intervals include both upper and lower limits. For example: In the given inclusive series, 10 – 19 includes all the numbers between 10 and 19 along with 10 and 19 also.
An exclusive series is that series where the class intervals include both upper and lower limits. We know that in an exclusive series, the upper limit of a class interval is equal to the lower limit of the next class interval. For example: In the exclusive series, \[9.5\] – \[19.5\] includes all the numbers between \[9.5\] and \[19.5\], including \[9.5\] but not \[19.5\].
It is important to convert an inclusive series into an exclusive series before making the less than or more than series.
Recently Updated Pages
Master Class 11 Computer Science: Engaging Questions & Answers for Success

Master Class 11 Business Studies: Engaging Questions & Answers for Success

Master Class 11 Economics: Engaging Questions & Answers for Success

Master Class 11 English: Engaging Questions & Answers for Success

Master Class 11 Maths: Engaging Questions & Answers for Success

Master Class 11 Biology: Engaging Questions & Answers for Success

Trending doubts
One Metric ton is equal to kg A 10000 B 1000 C 100 class 11 physics CBSE

There are 720 permutations of the digits 1 2 3 4 5 class 11 maths CBSE

Discuss the various forms of bacteria class 11 biology CBSE

Draw a diagram of a plant cell and label at least eight class 11 biology CBSE

State the laws of reflection of light

Explain zero factorial class 11 maths CBSE


