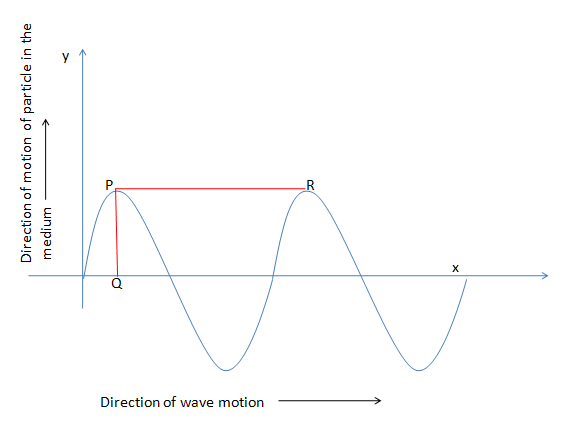
The graph of a wave motion is given below .Observe the graph and answer the following questions
a. What type of wave is represented in the graph ?
b. What do PQ and PR indicate with respect to the wave ?


Answer
556.2k+ views
Hint: The points of a transverse wave oscillate along the perpendicular path which shows the direction of the wave motion. This wave can be represented through a sine or cosine curve.
The amplitude of the wave is the highest displacement of the wave from its initial position and the wavelength can be measured from the length of the two consecutive highest picks of that wave.
Complete step by step answer:

• The diagram is showing that a wave is moving towards the horizontal direction i.e $x - axis$ and each particle of the wave is moving towards the vertical direction i.e $y - axis$. Hence the motion of the wave and the motion of the particles is perpendicular to each other. So it is a transverse wave. Since the wave starts from the main point or the $0$ state, it describes a Sine wave.
• In the diagram $PQ$ is the amplitude. The amplitude of a wave can be defined as the highest displacement of the wave from its initial position.
• In the diagram $PR$ is the wavelength of the wave. Wavelength is the length of a complete wave or we can say the distance between two consecutive same phased particles on the wave, is called the wavelength.
• Generally, we can also include that the length of the two consecutive highest picks of that wave is called the wavelength. Hence here in the diagram, the mentioned line $PR$ is the wavelength as it is showing the distance between two consecutive
Note: The transverse wave can be represented by sine or cosine function as harmonic function. So we may write the equation of motion of a wave, $y = a\sin \omega t$ and $y = a\cos \omega t$
Where, $y$ is the position of a particle on the wave at time $t$ , $\omega $ is the angular frequency and, $a$ is the amplitude.
Also the equation can be represented, $y = a\sin \omega \left( {t + \dfrac{x}{V}} \right)$ and $y = a\cos \omega \left( {t + \dfrac{x}{V}} \right)$
$x$ is the displacement and $V$ is the velocity of the wave.
The amplitude of the wave is the highest displacement of the wave from its initial position and the wavelength can be measured from the length of the two consecutive highest picks of that wave.
Complete step by step answer:

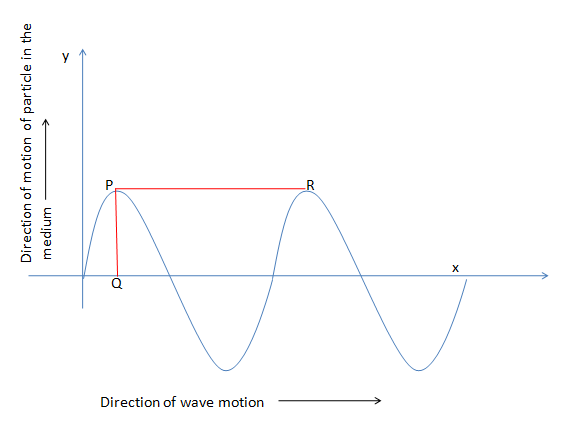
• The diagram is showing that a wave is moving towards the horizontal direction i.e $x - axis$ and each particle of the wave is moving towards the vertical direction i.e $y - axis$. Hence the motion of the wave and the motion of the particles is perpendicular to each other. So it is a transverse wave. Since the wave starts from the main point or the $0$ state, it describes a Sine wave.
• In the diagram $PQ$ is the amplitude. The amplitude of a wave can be defined as the highest displacement of the wave from its initial position.
• In the diagram $PR$ is the wavelength of the wave. Wavelength is the length of a complete wave or we can say the distance between two consecutive same phased particles on the wave, is called the wavelength.
• Generally, we can also include that the length of the two consecutive highest picks of that wave is called the wavelength. Hence here in the diagram, the mentioned line $PR$ is the wavelength as it is showing the distance between two consecutive
Note: The transverse wave can be represented by sine or cosine function as harmonic function. So we may write the equation of motion of a wave, $y = a\sin \omega t$ and $y = a\cos \omega t$
Where, $y$ is the position of a particle on the wave at time $t$ , $\omega $ is the angular frequency and, $a$ is the amplitude.
Also the equation can be represented, $y = a\sin \omega \left( {t + \dfrac{x}{V}} \right)$ and $y = a\cos \omega \left( {t + \dfrac{x}{V}} \right)$
$x$ is the displacement and $V$ is the velocity of the wave.
Recently Updated Pages
Master Class 12 Economics: Engaging Questions & Answers for Success

Master Class 12 Physics: Engaging Questions & Answers for Success

Master Class 12 English: Engaging Questions & Answers for Success

Master Class 12 Social Science: Engaging Questions & Answers for Success

Master Class 12 Maths: Engaging Questions & Answers for Success

Master Class 12 Business Studies: Engaging Questions & Answers for Success

Trending doubts
Which are the Top 10 Largest Countries of the World?

What are the major means of transport Explain each class 12 social science CBSE

Draw a labelled sketch of the human eye class 12 physics CBSE

Why cannot DNA pass through cell membranes class 12 biology CBSE

Differentiate between insitu conservation and exsitu class 12 biology CBSE

Draw a neat and well labeled diagram of TS of ovary class 12 biology CBSE


