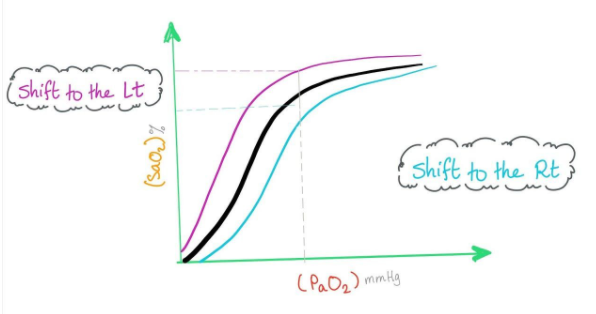
The graph shows an oxygen dissociation curve for haemoglobin.
Where in the body will haemoglobin be saturated at the percentages shown at points 1,2 and 3 on the graph?

A. Left ventricle 1, pulmonary vein 2, vena ceva 3.
B. Left ventricle 2, pulmonary vein 1, vena ceva 3.
C. Left ventricle 2, pulmonary vein 3, vena ceva 1.
D. Left ventricle 3, pulmonary vein 2, vena ceva 1.

Answer
567.3k+ views
Hint: The relationship between the partial pressure of oxygen and percentage saturation of the hemoglobin with oxygen is graphically illustrated by a curve called oxygen dissociation curve.
Complete answer:
The oxygen dissociation curve is a graph with oxygen partial pressure along the horizontal axis and oxygen saturation on the vertical axis, which shows an S shaped relationship. Oxygen and carbon dioxide are transported in the blood as a result of changes in blood partial pressures
The partial pressure is defined as the pressure of a single gas component in a mixture of gases. It corresponds to the total pressure which the single gas component would exert if alone occupied the whole volume .
The hemoglobin is most saturated with oxygen in the pulmonary vein, as this vein is carrying oxygenated blood from the lungs towards the left auricle of the heart. From the left auricle the blood moves to the left ventricle when saturation of hemoglobin with oxygen slightly reduces. Vena cava carries deoxygenated blood from all the organs of the body towards the right auricle, does hemoglobin is less saturated with oxygen.
Hence, the correct answer is option (C).
Additional information: The oxygen hemoglobin curve can be displaced such that the affinity for oxygen is altered. Factors that shift the curve include changes in carbon dioxide concentration, blood temperature, blood pH and the concentration of 2,2- diphosphoglycerate.
Note:The partial pressure of oxygen is decreased through several disease processes The primary process is include decreased inhaled oxygen, hyperventilation, diffusion limitations and ventilation or perfusion mismatching
Recently Updated Pages
Master Class 12 Economics: Engaging Questions & Answers for Success

Master Class 12 Physics: Engaging Questions & Answers for Success

Master Class 12 English: Engaging Questions & Answers for Success

Master Class 12 Social Science: Engaging Questions & Answers for Success

Master Class 12 Maths: Engaging Questions & Answers for Success

Master Class 12 Business Studies: Engaging Questions & Answers for Success

Trending doubts
Which are the Top 10 Largest Countries of the World?

What are the major means of transport Explain each class 12 social science CBSE

Draw a labelled sketch of the human eye class 12 physics CBSE

Why cannot DNA pass through cell membranes class 12 biology CBSE

Differentiate between insitu conservation and exsitu class 12 biology CBSE

Draw a neat and well labeled diagram of TS of ovary class 12 biology CBSE


