


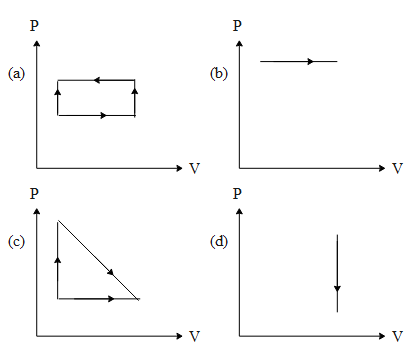
The indicator diagrams representing maximum and minimum amounts of work done are respectively
A) a and b
B) b and c
C) b and d
D) c and d
Answer
533.7k+ views
Hint: The work done when a gas is compressed or expands is basically given by the area under the curve in a PV diagram. If the work done is carried out in such a way that the net volume reduces, the work done is negative and if it increases the work done is positive. Hence by determining the area under the curve of pressure and change in volume, will enable us to determine the graph of maximum and the minimum work done.
Formula used:
$W=\int{PdV}$
Complete step-by-step answer:
Let us say if a gas is compressed or it expands, the work done (W) at pressure P such that the change in volume is ‘dV’ is given by,
$W=\int{PdV}$
From the above equation we can draw a conclusion if the volume of the gas does not change in a PV diagram i.e. ‘dV = 0’, we can imply the work done will be zero or minimum. In graph d, the volume of the gas does not change. Hence the minimum work done corresponds to graph ‘d’.
The above equation of work done basically means the area under the PV curve in the PV diagram. If we observe the above graphs, The coordinate of pressure in graph b is the highest whereas the change in volume for all of them is approximately the same. Since work done is the product of pressure times the change in volume the area under the graph of ‘b’ is maximum and hence the work done is also maximum.
So, the correct answer is “Option C”.
Note: It is to be noted that the net work done in graph ‘a’ is negative. This does not mean that the work done is smaller. The basic interpretation of that is that the work is done on the gas and not by the gas.
Recently Updated Pages
Master Class 11 Computer Science: Engaging Questions & Answers for Success
Master Class 11 Business Studies: Engaging Questions & Answers for Success
Master Class 11 Economics: Engaging Questions & Answers for Success
Master Class 11 English: Engaging Questions & Answers for Success
Master Class 11 Maths: Engaging Questions & Answers for Success
Master Class 11 Biology: Engaging Questions & Answers for Success
Trending doubts
One Metric ton is equal to kg A 10000 B 1000 C 100 class 11 physics CBSE
There are 720 permutations of the digits 1 2 3 4 5 class 11 maths CBSE
Discuss the various forms of bacteria class 11 biology CBSE
Draw a diagram of a plant cell and label at least eight class 11 biology CBSE
State the laws of reflection of light
Explain zero factorial class 11 maths CBSE