


The pictorial representation of data is called _______
A. attractive graph
B. Pictograph
C. bar graph
D. pi diagram
Answer
580.8k+ views
Hint: We will use the definition of each given option, that is, attractive graph, pictograph and bar graph, to find the correct answer.
Complete step-by-step answer:
There is no graph with the name attractive graph. Hence, option (a) is not the correct answer.
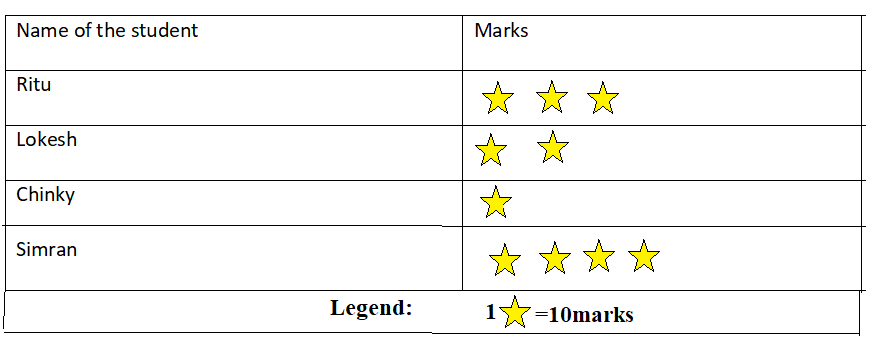
A pictograph is a method to show the data through pictures.
It is an interesting way to show data. But, sometimes we cannot draw the accurate data because we are not able to find a correct scale to represent the given data.
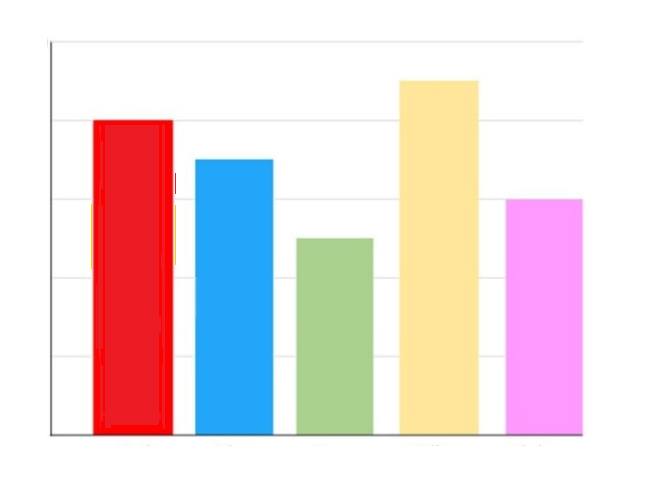
A bar graph is a method to show data in the forms of solid bars, which helps in comparing the different observations.
A pi diagram is used in analysis of orientation of folds and is not used to represent data.
Hence, the pictorial representation of data is called pictograph.
Thus, option B is the correct answer.
Note: One must know the definition of bar graphs and pictograph to do this question correctly. A pictograph makes it easy to read and compare data but it can be drawn accurately only when we can find a proper scale.
Complete step-by-step answer:
There is no graph with the name attractive graph. Hence, option (a) is not the correct answer.
A pictograph is a method to show the data through pictures.
It is an interesting way to show data. But, sometimes we cannot draw the accurate data because we are not able to find a correct scale to represent the given data.
A bar graph is a method to show data in the forms of solid bars, which helps in comparing the different observations.
A pi diagram is used in analysis of orientation of folds and is not used to represent data.
Hence, the pictorial representation of data is called pictograph.
Thus, option B is the correct answer.
Note: One must know the definition of bar graphs and pictograph to do this question correctly. A pictograph makes it easy to read and compare data but it can be drawn accurately only when we can find a proper scale.
Recently Updated Pages
Master Class 9 General Knowledge: Engaging Questions & Answers for Success
Master Class 9 Social Science: Engaging Questions & Answers for Success
Master Class 9 English: Engaging Questions & Answers for Success
Master Class 9 Maths: Engaging Questions & Answers for Success
Master Class 9 Science: Engaging Questions & Answers for Success
Class 9 Question and Answer - Your Ultimate Solutions Guide
Trending doubts
Difference Between Plant Cell and Animal Cell
Fill the blanks with the suitable prepositions 1 The class 9 english CBSE
Who is eligible for RTE class 9 social science CBSE
Which places in India experience sunrise first and class 9 social science CBSE
What is pollution? How many types of pollution? Define it
Name 10 Living and Non living things class 9 biology CBSE