


The potential difference between the inductor is the emf of the source when t=0, so does the potential difference vary until the steady state current? What is the voltage-time graph for an inductor when the switch closes?
Answer
522.6k+ views
Hint: You could begin from the expression for the voltage across the inductor. You could then find the value of voltage by substituting for t as 0. From the very expression, you will clearly get the exponential relationship between the quantities. You could accordingly make the required plot.
Complete step-by-step solution:
We know very well that the potential difference between the inductor would be the emf of the source when the time was t=0. We are supposed to find how the potential difference varies until it reaches the steady state current. We are also required to find the voltage-time graph for an inductor when the switch is closed.
Let us recall the voltage across an inductor given by,
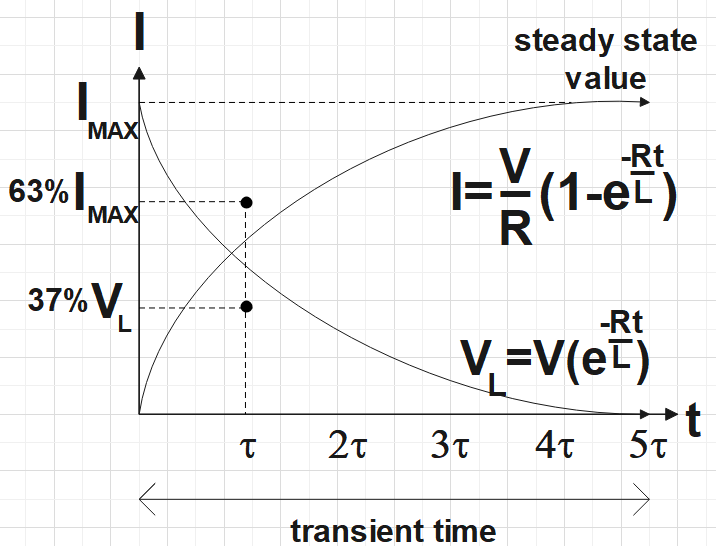
${{V}_{L}}={{V}_{B}}{{e}^{-\left( \dfrac{tR}{L} \right)}}$
When the time t=0, ${{V}_{L}}={{V}_{B}}$
We know from the relation that the voltage over the inductor would show an exponential decrease and for the voltage across series would show an exponential increase. So the voltage across the resistor would be,
${{V}_{R}}={{V}_{B}}-{{V}_{L}}$
Also, ${{V}_{R}}=IR$
$\Rightarrow I=\dfrac{{{V}_{R}}}{R}\left( 1-{{e}^{-\left( \dfrac{tR}{L} \right)}} \right)$
So the required graph would look as the following:
Note: In the expression for voltage, we could take the value of resistance as 0, that is, on substituting R=0, ${{e}^{-\dfrac{Rt}{L}}}=1$. But if we assume an ideal voltage source here, the current would asymptote to infinity for R=0. Hence, we could say that this wouldn’t happen.
Complete step-by-step solution:
We know very well that the potential difference between the inductor would be the emf of the source when the time was t=0. We are supposed to find how the potential difference varies until it reaches the steady state current. We are also required to find the voltage-time graph for an inductor when the switch is closed.
Let us recall the voltage across an inductor given by,
${{V}_{L}}={{V}_{B}}{{e}^{-\left( \dfrac{tR}{L} \right)}}$
When the time t=0, ${{V}_{L}}={{V}_{B}}$
We know from the relation that the voltage over the inductor would show an exponential decrease and for the voltage across series would show an exponential increase. So the voltage across the resistor would be,
${{V}_{R}}={{V}_{B}}-{{V}_{L}}$
Also, ${{V}_{R}}=IR$
$\Rightarrow I=\dfrac{{{V}_{R}}}{R}\left( 1-{{e}^{-\left( \dfrac{tR}{L} \right)}} \right)$
So the required graph would look as the following:
Note: In the expression for voltage, we could take the value of resistance as 0, that is, on substituting R=0, ${{e}^{-\dfrac{Rt}{L}}}=1$. But if we assume an ideal voltage source here, the current would asymptote to infinity for R=0. Hence, we could say that this wouldn’t happen.
Recently Updated Pages
Master Class 12 Economics: Engaging Questions & Answers for Success
Master Class 12 Physics: Engaging Questions & Answers for Success
Master Class 12 English: Engaging Questions & Answers for Success
Master Class 12 Social Science: Engaging Questions & Answers for Success
Master Class 12 Maths: Engaging Questions & Answers for Success
Master Class 12 Business Studies: Engaging Questions & Answers for Success
Trending doubts
Which are the Top 10 Largest Countries of the World?
What are the major means of transport Explain each class 12 social science CBSE
Draw a labelled sketch of the human eye class 12 physics CBSE
Why cannot DNA pass through cell membranes class 12 biology CBSE
Differentiate between insitu conservation and exsitu class 12 biology CBSE
Draw a neat and well labeled diagram of TS of ovary class 12 biology CBSE