


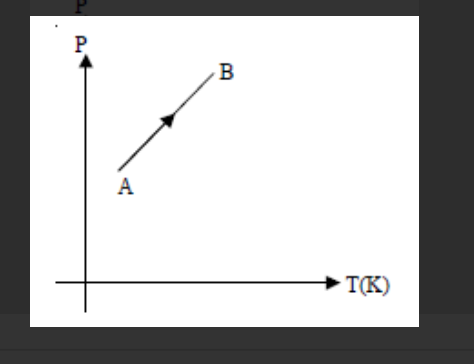
The P-T graph for the given mass of an ideal gas is shown in figure. Then the volume
(A) Increases
(B) Decreases
(C) Remains constant
(D) Data sufficient
Answer
232.8k+ views
Hint: We know that in these graphs, the vertical axis represents the position of the object while the horizontal axis represents the time elapsed: the dependent variable, position, depends on the independent variable, time. In this way, the graph tells us where the particle can be found after some amount of time.The physical interpretation of mathematical slope is similar. A positive slope rises to the right and a negative slope rises to the left (or falls to the right). A slope can vary in degree, from slight (a small rise over a large run) to steep (a large rise over a small run).The slope of a velocity graph represents the acceleration of the object. So, the value of the slope at a particular time represents the acceleration of the object at that instant.The slope of a line in the plane containing the x and y axes is generally represented by the letter m, and is defined as the change in the y coordinate divided by the corresponding change in the x coordinate, between two distinct points on the line.
Complete step by step answer
We know that an ideal gas is defined as one in which all collisions between atoms or molecules are perfectly elastic and in which there are no intermolecular attractive forces. One can visualize it as a collection of perfectly hard spheres which collide but which otherwise do not interact with each other. The dimensions of the universal gas constant R are energy per degree per mole. In the metre-kilogram-second system, the value of R is 8.3144598 joules per kelvin (K) per mole.
We can say that the gas constant is also known as the molar, universal, or ideal gas constant, denoted by the symbol R or R and is equivalent to the Boltzmann constant, but expressed in units of energy per temperature increment per mole, i.e. the pressure-volume product, rather than energy per temperature increment per particle
From the graph it is clear that $\mathrm{P}$ is directly proportional to T. For an ideal gas it happens, when volume remains constant.
So, the correct answer is option C.
Note We know that the properties of an ideal gas are: An ideal gas consists of a large number of identical molecules. The volume occupied by the molecules themselves is negligible compared to the volume occupied by the gas. The molecules obey Newton's laws of motion, and they move in random motion.Ideal means it has no existence it only exist in mind of scientists.As you know air is mixture of different gasses contain mainly nitrogen and oxygen which molecules show attraction to each so we can concluded that air is not ideal gas. but you can make it at low pressure and high temperature.The real gas that acts most like an ideal gas is helium. This is because helium, unlike most gases, exists as a single atom, which makes the van der Waals dispersion forces as low as possible. Another factor is that helium, like other noble gases, has a completely filled outer electron shell. Real gases are non ideal gases whose molecules occupy space and have interactions; consequently, they do not adhere to the ideal gas law.
The ideal gas law relates the four independent physical properties of a gas at any time. The ideal gas law can be used in stoichiometry problems in which chemical reactions involve gases. Standard temperature and pressure (STP) are a useful set of benchmark conditions to compare other properties of gases.
Recently Updated Pages
Dimensions of Charge: Dimensional Formula, Derivation, SI Units & Examples
How to Calculate Moment of Inertia: Step-by-Step Guide & Formulas
Circuit Switching vs Packet Switching: Key Differences Explained
Dimensions of Pressure in Physics: Formula, Derivation & SI Unit
JEE General Topics in Chemistry Important Concepts and Tips
JEE Extractive Metallurgy Important Concepts and Tips for Exam Preparation
Trending doubts
JEE Main 2026: Session 2 Registration Open, City Intimation Slip, Exam Dates, Syllabus & Eligibility
JEE Main 2026 Application Login: Direct Link, Registration, Form Fill, and Steps
JEE Main Marking Scheme 2026- Paper-Wise Marks Distribution and Negative Marking Details
Understanding the Angle of Deviation in a Prism
Hybridisation in Chemistry – Concept, Types & Applications
How to Convert a Galvanometer into an Ammeter or Voltmeter
Other Pages
JEE Advanced Marks vs Ranks 2025: Understanding Category-wise Qualifying Marks and Previous Year Cut-offs
Laws of Motion Class 11 Physics Chapter 4 CBSE Notes - 2025-26
Waves Class 11 Physics Chapter 14 CBSE Notes - 2025-26
Mechanical Properties of Fluids Class 11 Physics Chapter 9 CBSE Notes - 2025-26
Thermodynamics Class 11 Physics Chapter 11 CBSE Notes - 2025-26
Units And Measurements Class 11 Physics Chapter 1 CBSE Notes - 2025-26