


The work function of silver and sodium are 4.6 and 2.3eV respectively. The ratio of the slope of the stopping potential versus frequency plot for silver to that of sodium is
A) 1
B) 0.33
C) 0.67
D) 1.33
Answer
579.9k+ views
Hint: Here we have given the work function of silver and sodium and we have to find the ratio of slope of the stopping potential versus frequency plot for silver to sodium. For that we have to find a slope which we can by using the photoelectric equation. So we will write the photoelectric equation for stopping potential and then by comparing it to the equation of line we will get our slope.
Formula used:
\[\begin{align}
& h\nu =\phi +K.E. \\
& y=mx+c \\
\end{align}\]
Complete answer:
Work function is the minimum energy required by the surface of metals to emit a photon or remove an electron from its outermost shell whereas the stopping potential is the potential difference required to stop an electron from moving and producing a current. Now according to photoelectric equation the energy of photon emitted from the surface of the metal is given as sum of work function and the kinetic energy of the electron and the equation is shown below
\[h\nu =\phi +K.E.\]
Now the kinetic energy of the electron is given as the product of potential difference and the charge on the electron. In the photoelectric equation, the potential difference is the stopping potential which is denoted as \[{{V}_{0}}\]and we know the charge on an electron is e. Then the kinetic energy can be given as
\[K.E.=e{{V}_{0}}\]
Substituting this in photoelectric equation we get
\[h\nu =\phi +e{{V}_{0}}\]
Now rewriting it for stopping potential we get
\[\begin{align}
& e{{V}_{0}}=h\nu -\phi \\
& \Rightarrow {{V}_{0}}=\dfrac{h}{e}\nu -\dfrac{\phi }{e}\text{ }................\text{(i)} \\
\end{align}\]
Now the equation of line is given as
\[y=mx+c\]
Where y is the Y-coordinate, x is X-coordinate, m is the slope between x and y and c is the Y-intercept. Comparing this equation of line with the equation (i), we can say that the slope for the stopping potential versus frequency plot will be given as
\[m=\dfrac{h}{e}\]
And the graph between stopping potential and the frequency can be given as
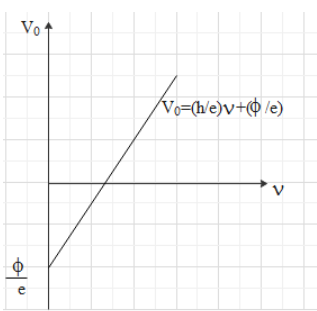
As h is Planck’s constant and e is the charge on an electron which will not change for any metal so the slope value of slope will be the same for every metal.
Hence the ratio of the slope for silver to sodium will be given as 1.
Correct option is A.
Note:
The point at which stopping potential is zero but we are getting some value of frequency is the point which gives us threshold frequency. Threshold frequency is the minimum frequency at which photons will be emitted. Below threshold frequency emission of photons won’t take place. In case the graph was plotted between K.E. and the work function then the slope will give us the value of Planck’s constant h.
Formula used:
\[\begin{align}
& h\nu =\phi +K.E. \\
& y=mx+c \\
\end{align}\]
Complete answer:
Work function is the minimum energy required by the surface of metals to emit a photon or remove an electron from its outermost shell whereas the stopping potential is the potential difference required to stop an electron from moving and producing a current. Now according to photoelectric equation the energy of photon emitted from the surface of the metal is given as sum of work function and the kinetic energy of the electron and the equation is shown below
\[h\nu =\phi +K.E.\]
Now the kinetic energy of the electron is given as the product of potential difference and the charge on the electron. In the photoelectric equation, the potential difference is the stopping potential which is denoted as \[{{V}_{0}}\]and we know the charge on an electron is e. Then the kinetic energy can be given as
\[K.E.=e{{V}_{0}}\]
Substituting this in photoelectric equation we get
\[h\nu =\phi +e{{V}_{0}}\]
Now rewriting it for stopping potential we get
\[\begin{align}
& e{{V}_{0}}=h\nu -\phi \\
& \Rightarrow {{V}_{0}}=\dfrac{h}{e}\nu -\dfrac{\phi }{e}\text{ }................\text{(i)} \\
\end{align}\]
Now the equation of line is given as
\[y=mx+c\]
Where y is the Y-coordinate, x is X-coordinate, m is the slope between x and y and c is the Y-intercept. Comparing this equation of line with the equation (i), we can say that the slope for the stopping potential versus frequency plot will be given as
\[m=\dfrac{h}{e}\]
And the graph between stopping potential and the frequency can be given as
As h is Planck’s constant and e is the charge on an electron which will not change for any metal so the slope value of slope will be the same for every metal.
Hence the ratio of the slope for silver to sodium will be given as 1.
Correct option is A.
Note:
The point at which stopping potential is zero but we are getting some value of frequency is the point which gives us threshold frequency. Threshold frequency is the minimum frequency at which photons will be emitted. Below threshold frequency emission of photons won’t take place. In case the graph was plotted between K.E. and the work function then the slope will give us the value of Planck’s constant h.
Recently Updated Pages
Master Class 12 Economics: Engaging Questions & Answers for Success
Master Class 12 Physics: Engaging Questions & Answers for Success
Master Class 12 English: Engaging Questions & Answers for Success
Master Class 12 Social Science: Engaging Questions & Answers for Success
Master Class 12 Maths: Engaging Questions & Answers for Success
Master Class 12 Business Studies: Engaging Questions & Answers for Success
Trending doubts
Which are the Top 10 Largest Countries of the World?
What are the major means of transport Explain each class 12 social science CBSE
Draw a labelled sketch of the human eye class 12 physics CBSE
Why cannot DNA pass through cell membranes class 12 biology CBSE
Differentiate between insitu conservation and exsitu class 12 biology CBSE
Draw a neat and well labeled diagram of TS of ovary class 12 biology CBSE