


How do you translate a graph left or right?
Answer
533.1k+ views
Hint: In order to translate a graph left or right , use the definition of horizontal translation which states that horizontal translation for some function $ f\left( x \right) $ is a function $ g\left( x \right) $ which has a relation $ g\left( x \right) = f\left( {x - c} \right) $ . Here $ c $ determines the direction of shift as if x is positive then there will be right shift by $ c\, $ units and when $ c $ is negative , then left shift by $ c $ units.
Complete step-by-step answer:
As per the question we have to answer how we will translate a graph left or right.
So translating a graph left or right in mathematical terms is actually doing horizontal translation for any function $ f\left( x \right) $ .
Let’s understand what a horizontal translation means. So horizontal translation means shifting the base graph for some function $ f\left( x \right) $ in the left or right direction over the x-axis. Suppose a graph is translated $ c $ units , then all the points on the graph will move $ c $ units in the horizontal direction.
Let the base function be $ f\left( x \right) $ and $ c $ as the constant value , then by definition the resultant graph or function $ g\left( x \right) $ will be
$ g\left( x \right) = f\left( {x - c} \right) $
The value of constant $ c $ actually determine the direction of the shift, whether left or right as :
If $ c > 0 $ , the base graph shifts to the right direction by $ c $ units and
If $ c < 0 $ , the base graph shifts to the left direction by $ c $ units
Let's look an example for horizontal translation to get the better understanding :
Suppose we have a base function $ f\left( x \right) = 2{x^2} $ and we have to find the graph for $ g\left( x \right) = f\left( {x - 2} \right) $ .
As we know the graph of the quadratic equation is parabola , so the graph of $ f\left( x \right) $ is also parabola.
So , by substituting all the occurrences of $ x $ with $ x - 2 $ in the $ f\left( x \right) $ we have the function $ g\left( x \right) $ as
$ g\left( x \right) = 2{\left( {x - 2} \right)^2} $
As per the definition of horizontal translation, we have constant $ c = 2 $ , which is positive. Hence the graph of $ g\left( x \right) $ will look like $ f\left( x \right) $ but shifted 2 units right .
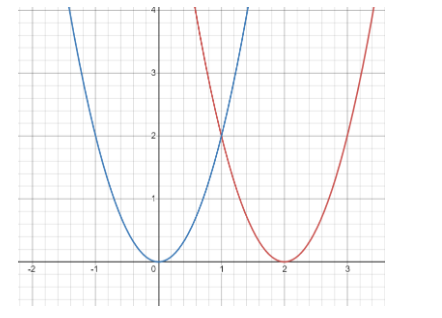
Blue coloured parabola depicts the graph of base function $ f\left( x \right) = 2{x^2} $ and
Red coloured parabola depicts the graph of $ g\left( x \right) = f\left( {x - 2} \right) = 2{\left( {x - 2} \right)^2} $
Note: 1.Draw the graph of functions on the cartesian plane only with the help of straight ruler and pencil to get the perfect and accurate results.
2.Mark the points carefully.
3. x-intercept is the point at which the graph intersects the x-axis of the plane and similarly y-intercept is the point at which graph intersects the y-axis of the plane.
4. Before solving problems related to graph translations, first check whether there is a vertical shift or horizontal shift. Horizontal shift is always have the form $ g\left( x \right) = f\left( {x - c} \right) $ and the vertical shift is in the form of $ g\left( x \right) = f\left( x \right) - c $ , where $ c $ is a constant value which determines units of shift.
5. Horizontal translation or Vertical translation , both do not affect the actual shape of any graph or function .
Complete step-by-step answer:
As per the question we have to answer how we will translate a graph left or right.
So translating a graph left or right in mathematical terms is actually doing horizontal translation for any function $ f\left( x \right) $ .
Let’s understand what a horizontal translation means. So horizontal translation means shifting the base graph for some function $ f\left( x \right) $ in the left or right direction over the x-axis. Suppose a graph is translated $ c $ units , then all the points on the graph will move $ c $ units in the horizontal direction.
Let the base function be $ f\left( x \right) $ and $ c $ as the constant value , then by definition the resultant graph or function $ g\left( x \right) $ will be
$ g\left( x \right) = f\left( {x - c} \right) $
The value of constant $ c $ actually determine the direction of the shift, whether left or right as :
If $ c > 0 $ , the base graph shifts to the right direction by $ c $ units and
If $ c < 0 $ , the base graph shifts to the left direction by $ c $ units
Let's look an example for horizontal translation to get the better understanding :
Suppose we have a base function $ f\left( x \right) = 2{x^2} $ and we have to find the graph for $ g\left( x \right) = f\left( {x - 2} \right) $ .
As we know the graph of the quadratic equation is parabola , so the graph of $ f\left( x \right) $ is also parabola.
So , by substituting all the occurrences of $ x $ with $ x - 2 $ in the $ f\left( x \right) $ we have the function $ g\left( x \right) $ as
$ g\left( x \right) = 2{\left( {x - 2} \right)^2} $
As per the definition of horizontal translation, we have constant $ c = 2 $ , which is positive. Hence the graph of $ g\left( x \right) $ will look like $ f\left( x \right) $ but shifted 2 units right .
Blue coloured parabola depicts the graph of base function $ f\left( x \right) = 2{x^2} $ and
Red coloured parabola depicts the graph of $ g\left( x \right) = f\left( {x - 2} \right) = 2{\left( {x - 2} \right)^2} $
Note: 1.Draw the graph of functions on the cartesian plane only with the help of straight ruler and pencil to get the perfect and accurate results.
2.Mark the points carefully.
3. x-intercept is the point at which the graph intersects the x-axis of the plane and similarly y-intercept is the point at which graph intersects the y-axis of the plane.
4. Before solving problems related to graph translations, first check whether there is a vertical shift or horizontal shift. Horizontal shift is always have the form $ g\left( x \right) = f\left( {x - c} \right) $ and the vertical shift is in the form of $ g\left( x \right) = f\left( x \right) - c $ , where $ c $ is a constant value which determines units of shift.
5. Horizontal translation or Vertical translation , both do not affect the actual shape of any graph or function .
Recently Updated Pages
Master Class 10 Computer Science: Engaging Questions & Answers for Success
Master Class 10 General Knowledge: Engaging Questions & Answers for Success
Master Class 10 English: Engaging Questions & Answers for Success
Master Class 10 Social Science: Engaging Questions & Answers for Success
Master Class 10 Maths: Engaging Questions & Answers for Success
Master Class 10 Science: Engaging Questions & Answers for Success
Trending doubts
What is the median of the first 10 natural numbers class 10 maths CBSE
Which women's tennis player has 24 Grand Slam singles titles?
Who is the Brand Ambassador of Incredible India?
Why is there a time difference of about 5 hours between class 10 social science CBSE
Write a letter to the principal requesting him to grant class 10 english CBSE
State and prove converse of BPT Basic Proportionality class 10 maths CBSE