


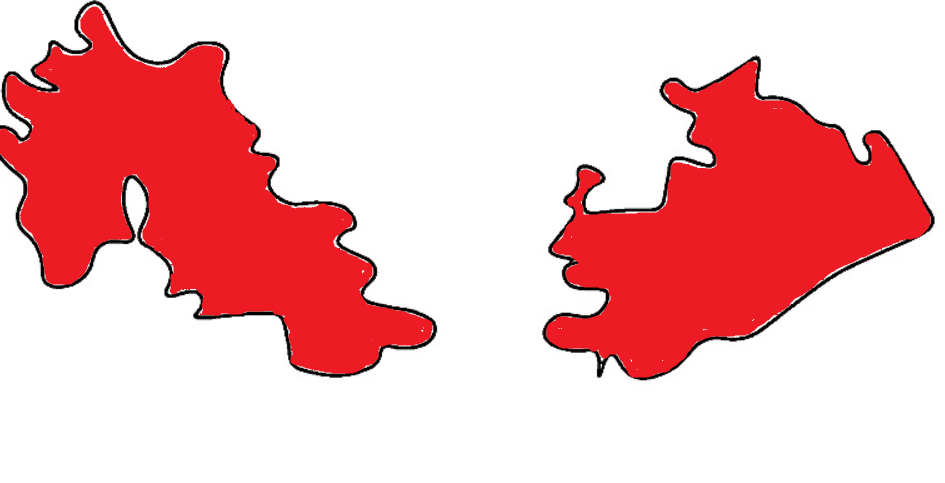
Use tracing paper and centimetre graph paper to compare the areas of the following pair of figures:
Answer
540k+ views
Hint: After drawing in the trace sheet, compare the number of squares covered by each of the figures.First, we trace the figures accordingly and then we place them on the centimetre graph paper, to measure the area covered (not precisely). Then we take a count of the squares that have been completely covered by the two figures. Which helps us compare the areas of the two given figures.
Complete step by step answer:
After tracing the figure and placing the tracing paper on the centimetre graph, we get this

Now, since we are using the centimetre graph, each square in the graph is equal to $1\,c{m^2}$.
Here, coming to the first figure, we can say that
Figure (I) has 4 complete, 9 more than half and 9 less than half squares.
Now, let us neglect the squares which are covered less than half by figure (I).
So, we have 13 squares covered
Since we know that each square in the graph is equal to $1\,c{m^2}$.
Area covered by figure (I) is $13\,c{m^2}$
Now coming, to the figure (II), we have 8 complete, 11 more than half and 10 less than half squares.
Now, let us neglect the squares which are covered less than half by figure (II).
So, we have 19 squares covered.
Since we know that each square in the graph is equal to $1\,c{m^2}$.
Area covered by figure (I) is $19\,c{m^2}$
Since, we have the approximate areas of the two figures, we can compare them.
On comparing the areas of both the shapes, we know that the figure (II) has an area greater than that of figure (I).
Note: We must preferably omit the squares which are covered less than half such that we can have a uniform way to calculate the area covered by the figures by rounding up to perfect squares which are covering more than half of the square.
Complete step by step answer:
After tracing the figure and placing the tracing paper on the centimetre graph, we get this
Now, since we are using the centimetre graph, each square in the graph is equal to $1\,c{m^2}$.
Here, coming to the first figure, we can say that
Figure (I) has 4 complete, 9 more than half and 9 less than half squares.
Now, let us neglect the squares which are covered less than half by figure (I).
So, we have 13 squares covered
Since we know that each square in the graph is equal to $1\,c{m^2}$.
Area covered by figure (I) is $13\,c{m^2}$
Now coming, to the figure (II), we have 8 complete, 11 more than half and 10 less than half squares.
Now, let us neglect the squares which are covered less than half by figure (II).
So, we have 19 squares covered.
Since we know that each square in the graph is equal to $1\,c{m^2}$.
Area covered by figure (I) is $19\,c{m^2}$
Since, we have the approximate areas of the two figures, we can compare them.
On comparing the areas of both the shapes, we know that the figure (II) has an area greater than that of figure (I).
Note: We must preferably omit the squares which are covered less than half such that we can have a uniform way to calculate the area covered by the figures by rounding up to perfect squares which are covering more than half of the square.
Recently Updated Pages
Master Class 8 Social Science: Engaging Questions & Answers for Success
Master Class 8 English: Engaging Questions & Answers for Success
Class 8 Question and Answer - Your Ultimate Solutions Guide
Master Class 8 Maths: Engaging Questions & Answers for Success
Master Class 8 Science: Engaging Questions & Answers for Success
Master Class 7 English: Engaging Questions & Answers for Success
Trending doubts
What is BLO What is the full form of BLO class 8 social science CBSE
Citizens of India can vote at the age of A 18 years class 8 social science CBSE
Full form of STD, ISD and PCO
Advantages and disadvantages of science
Right to vote is a AFundamental Right BFundamental class 8 social science CBSE
What are the 12 elements of nature class 8 chemistry CBSE