


What is a bimodal distribution?
Answer
524.7k+ views
Hint: Data distributions in statistics can have one peak, or they can have several peaks. The type of distribution you might be familiar with seeing is the normal distribution, or bell curve, which has one peak. The bimodal distribution has \[2\] peaks.
Complete step by step solution:
The “bi” in bimodal distribution refers to “\[2\]” and modal refers to the peaks. The two peaks in a bimodal distribution also represent two local maximums; these are points where the data points stop increasing and start decreasing.
For example, the distribution of heights in a sample of adults might have two peaks, one for women and one for men.
Another example is exam scores which tend to be normally distributed with a single peak. However, grades sometimes fall into a bimodal distribution with a lot of students getting A grades and a lot getting F grades. This can tell you that you are looking at two different groups of students. It could be that one group is underprepared for the class (perhaps because of a lack of previous classes). The other group may have over prepared.
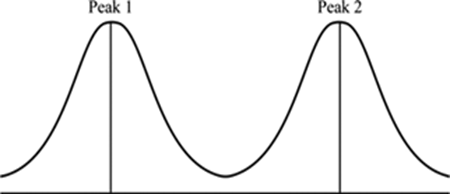
Bimodal distribution showing two normal distribution curves combined, to show peaks in following diagram:
Bimodal distributions are a commonly used example of how summary statistics such as the mean, median, and standard deviation can be deceptive when used on an arbitrary distribution. Application of bimodal distribution to the detection of changes in uranium concentration in drinking water is notable.
Note:
Sometimes, what appears to be a bimodal distribution is actually two unimodal (one-peaked) distributions graphed on the same axis. Multimodal distributions have more than two peaks. Although bimodal (or multimodal) distributions can be revealing of systematic biases or issues, they often occur naturally as well. These naturally bimodal distributed variables include the colour of galaxies, the size of worker weaver ants, the age of incidence of Hodgkin’s lymphoma, traffic analysis, water demand etc.
Complete step by step solution:
The “bi” in bimodal distribution refers to “\[2\]” and modal refers to the peaks. The two peaks in a bimodal distribution also represent two local maximums; these are points where the data points stop increasing and start decreasing.
For example, the distribution of heights in a sample of adults might have two peaks, one for women and one for men.
Another example is exam scores which tend to be normally distributed with a single peak. However, grades sometimes fall into a bimodal distribution with a lot of students getting A grades and a lot getting F grades. This can tell you that you are looking at two different groups of students. It could be that one group is underprepared for the class (perhaps because of a lack of previous classes). The other group may have over prepared.
Bimodal distribution showing two normal distribution curves combined, to show peaks in following diagram:
Bimodal distributions are a commonly used example of how summary statistics such as the mean, median, and standard deviation can be deceptive when used on an arbitrary distribution. Application of bimodal distribution to the detection of changes in uranium concentration in drinking water is notable.
Note:
Sometimes, what appears to be a bimodal distribution is actually two unimodal (one-peaked) distributions graphed on the same axis. Multimodal distributions have more than two peaks. Although bimodal (or multimodal) distributions can be revealing of systematic biases or issues, they often occur naturally as well. These naturally bimodal distributed variables include the colour of galaxies, the size of worker weaver ants, the age of incidence of Hodgkin’s lymphoma, traffic analysis, water demand etc.
Recently Updated Pages
Master Class 12 Economics: Engaging Questions & Answers for Success
Master Class 12 Physics: Engaging Questions & Answers for Success
Master Class 12 English: Engaging Questions & Answers for Success
Master Class 12 Social Science: Engaging Questions & Answers for Success
Master Class 12 Maths: Engaging Questions & Answers for Success
Master Class 12 Business Studies: Engaging Questions & Answers for Success
Trending doubts
Which are the Top 10 Largest Countries of the World?
What are the major means of transport Explain each class 12 social science CBSE
Draw a labelled sketch of the human eye class 12 physics CBSE
Why cannot DNA pass through cell membranes class 12 biology CBSE
Differentiate between insitu conservation and exsitu class 12 biology CBSE
Draw a neat and well labeled diagram of TS of ovary class 12 biology CBSE