


What is a PV indicator diagram?
Answer
497.4k+ views
Hint: In order to solve this question we need to understand the PV indicator diagram. PV indicator diagram is a graph between the pressure and volume of a system. PV indicator is commonly used in thermodynamics, cardiovascular physiology, and respiratory physiology. The p-v diagram is originally called indicator diagram.
Complete answer:
Indicator diagram (P-V diagram) A curve showing variation of volume of a substance taken along the X-axis and the variation of pressure taken along Y-axis is called an indicator diagram or P-V diagram. The shape of the indicator diagram shall depend on the nature of the thermodynamic process the system undergoes.
A curve showing variation of volume of a substance taken along the X-axis and the variation of pressure taken along Y-axis is called an indicator diagram or P-V diagram. The shape of the indicator diagram shall depend on the nature of the thermodynamic process the system undergoes.
Let us consider one mole of an ideal gas enclosed in a cylinder fitted with a perfectly frictionless piston.
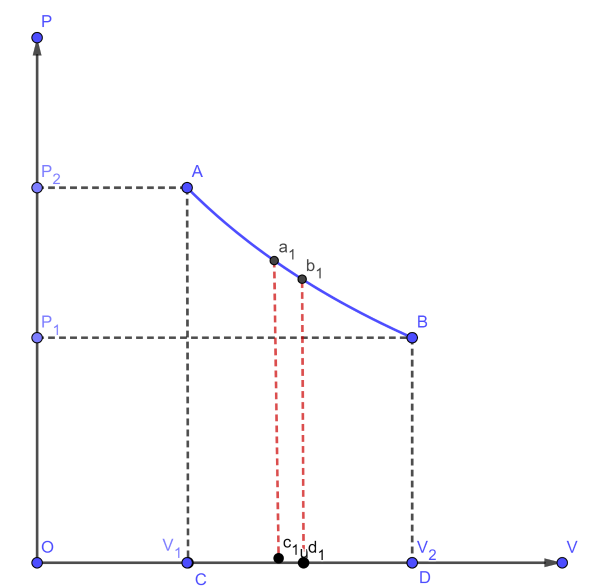
Let, $ {P_1}, $ $ {V_1} $ and T be the initial state of the gas. If dV is an infinitesimally small increase in volume of the gas during which the pressure P is assumed to be constant, then small amount of work done by the gas is $ dW = PdV $
In the indicator diagram,
$ dW = {\text{area }}{a_1}{b_1}{c_1}{d_1} $
The total work done by the gas during expansion from $ {V_1} $ and $ {V_2} $ is,
$ W = \int\limits_{{v_1}}^{{v_2}} {PdV} = {\text{ Area ABCD, in the indicator diagram}} $
Hence, in an indicator diagram the area under the curve represents the work done.
Note:
It should be remembered that the p-v diagram is originally called indicator diagram. The pressure and volume diagram are used to describe corresponding changes in a system. The pressure and volume diagram are used to estimate the net work performed by a thermodynamic cycle. The total area under the curve on a PV diagram, is we can find the work done by determining.
Complete answer:
Indicator diagram (P-V diagram) A curve showing variation of volume of a substance taken along the X-axis and the variation of pressure taken along Y-axis is called an indicator diagram or P-V diagram. The shape of the indicator diagram shall depend on the nature of the thermodynamic process the system undergoes.
A curve showing variation of volume of a substance taken along the X-axis and the variation of pressure taken along Y-axis is called an indicator diagram or P-V diagram. The shape of the indicator diagram shall depend on the nature of the thermodynamic process the system undergoes.
Let us consider one mole of an ideal gas enclosed in a cylinder fitted with a perfectly frictionless piston.
Let, $ {P_1}, $ $ {V_1} $ and T be the initial state of the gas. If dV is an infinitesimally small increase in volume of the gas during which the pressure P is assumed to be constant, then small amount of work done by the gas is $ dW = PdV $
In the indicator diagram,
$ dW = {\text{area }}{a_1}{b_1}{c_1}{d_1} $
The total work done by the gas during expansion from $ {V_1} $ and $ {V_2} $ is,
$ W = \int\limits_{{v_1}}^{{v_2}} {PdV} = {\text{ Area ABCD, in the indicator diagram}} $
Hence, in an indicator diagram the area under the curve represents the work done.
Note:
It should be remembered that the p-v diagram is originally called indicator diagram. The pressure and volume diagram are used to describe corresponding changes in a system. The pressure and volume diagram are used to estimate the net work performed by a thermodynamic cycle. The total area under the curve on a PV diagram, is we can find the work done by determining.
Recently Updated Pages
Master Class 11 Computer Science: Engaging Questions & Answers for Success
Master Class 11 Business Studies: Engaging Questions & Answers for Success
Master Class 11 Economics: Engaging Questions & Answers for Success
Master Class 11 English: Engaging Questions & Answers for Success
Master Class 11 Maths: Engaging Questions & Answers for Success
Master Class 11 Biology: Engaging Questions & Answers for Success
Trending doubts
One Metric ton is equal to kg A 10000 B 1000 C 100 class 11 physics CBSE
There are 720 permutations of the digits 1 2 3 4 5 class 11 maths CBSE
Discuss the various forms of bacteria class 11 biology CBSE
Draw a diagram of a plant cell and label at least eight class 11 biology CBSE
State the laws of reflection of light
Explain zero factorial class 11 maths CBSE