


What is the graph of, $y={{\sin }^{-1}}(x)$ ?
Answer
529.8k+ views
Hint: To plot the graph of any function, we first need to find the domain and range of the function. Here, the given function is, $y={{\sin }^{-1}}(x)$, which is the inverse of a ‘sine’ function. Thus, we shall use the properties of inverse function to find and plot the graph of ${{\sin }^{-1}}(x)$.
Complete step by step solution:
Let us first assign some terms that we are going to use later in our solution.
Let, $f(x)=\sin (x)$ be our fundamental function such that the equation, $y={{\sin }^{-1}}(x)$, is the inverse of this function.
By the property of inverse function, we can say that the domain of the fundamental function is equal to the range of the inverse function and the range of the fundamental function is equal to the domain of the inverse function.
Using this above property, we will first find the domain of ${{\sin }^{-1}}(x)$. This will be equal to the range of $\sin (x)$. Mathematically, this could be written as:
$\begin{align}
& \Rightarrow D\left[ {{\sin }^{-1}}(x) \right]=R\left[ \sin (x) \right] \\
& \therefore \Rightarrow D\left[ {{\sin }^{-1}}(x) \right]=\left[ -1,1 \right] \\
\end{align}$
Now, using the same property, we will find the range of ${{\sin }^{-1}}(x)$in the interval $\left[ -1,1 \right]$. Thus, for this restricted domain the range of ${{\sin }^{-1}}(x)$ will be equal to:
$\Rightarrow R\left[ {{\sin }^{-1}}(x) \right]=\left[ -\dfrac{\pi }{2},\dfrac{\pi }{2} \right]$
Now, we have the domain and the range of the sine inverse function.
Lastly, ${{\sin }^{-1}}(x)$ being an inverse function of $\sin (x)$, will be a mirror image of $\sin (x)$ about the, $y=x$ line. Thus the graph of ${{\sin }^{-1}}(x)$ can be plotted as follows:
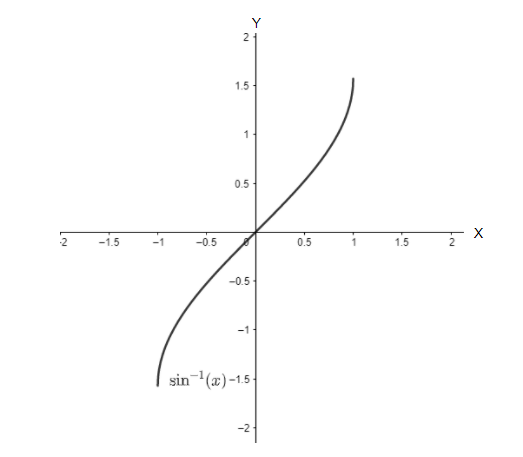
Here, the function validates all the required conditions. Hence, the above plot is the correct plot of $y={{\sin }^{-1}}(x)$.
Note: Before finding the plot of a function, we should check if the inverse of the fundamental function exists or not. If it exists, then we should always find the domain and range of the inverse function with the help of the fundamental function and then only apply the mirror technique to find the plot of the inverse function.
Complete step by step solution:
Let us first assign some terms that we are going to use later in our solution.
Let, $f(x)=\sin (x)$ be our fundamental function such that the equation, $y={{\sin }^{-1}}(x)$, is the inverse of this function.
By the property of inverse function, we can say that the domain of the fundamental function is equal to the range of the inverse function and the range of the fundamental function is equal to the domain of the inverse function.
Using this above property, we will first find the domain of ${{\sin }^{-1}}(x)$. This will be equal to the range of $\sin (x)$. Mathematically, this could be written as:
$\begin{align}
& \Rightarrow D\left[ {{\sin }^{-1}}(x) \right]=R\left[ \sin (x) \right] \\
& \therefore \Rightarrow D\left[ {{\sin }^{-1}}(x) \right]=\left[ -1,1 \right] \\
\end{align}$
Now, using the same property, we will find the range of ${{\sin }^{-1}}(x)$in the interval $\left[ -1,1 \right]$. Thus, for this restricted domain the range of ${{\sin }^{-1}}(x)$ will be equal to:
$\Rightarrow R\left[ {{\sin }^{-1}}(x) \right]=\left[ -\dfrac{\pi }{2},\dfrac{\pi }{2} \right]$
Now, we have the domain and the range of the sine inverse function.
Lastly, ${{\sin }^{-1}}(x)$ being an inverse function of $\sin (x)$, will be a mirror image of $\sin (x)$ about the, $y=x$ line. Thus the graph of ${{\sin }^{-1}}(x)$ can be plotted as follows:
Here, the function validates all the required conditions. Hence, the above plot is the correct plot of $y={{\sin }^{-1}}(x)$.
Note: Before finding the plot of a function, we should check if the inverse of the fundamental function exists or not. If it exists, then we should always find the domain and range of the inverse function with the help of the fundamental function and then only apply the mirror technique to find the plot of the inverse function.
Recently Updated Pages
Master Class 12 Economics: Engaging Questions & Answers for Success
Master Class 12 Physics: Engaging Questions & Answers for Success
Master Class 12 English: Engaging Questions & Answers for Success
Master Class 12 Social Science: Engaging Questions & Answers for Success
Master Class 12 Maths: Engaging Questions & Answers for Success
Master Class 12 Business Studies: Engaging Questions & Answers for Success
Trending doubts
Why cannot DNA pass through cell membranes class 12 biology CBSE
Differentiate between insitu conservation and exsitu class 12 biology CBSE
Draw a neat and well labeled diagram of TS of ovary class 12 biology CBSE
In a human foetus the limbs and digits develop after class 12 biology CBSE
AABbCc genotype forms how many types of gametes a 4 class 12 biology CBSE
The correct structure of ethylenediaminetetraacetic class 12 chemistry CBSE