What is the Z score for \[95\%\]?
Answer
533.7k+ views
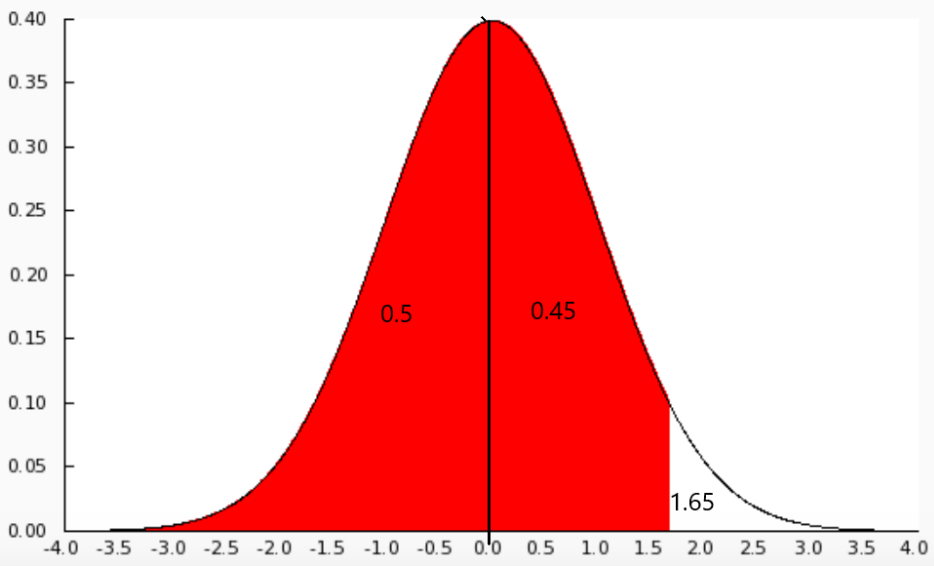
Hint: In this problem, we have to find the Z score for \[95\%\]. We can see that this statistical problem is based on the z confidence interval for the mean. We should know that to obtain the value for the given percentage, we have to refer to the area under the Normal distribution table. We can first draw the area and split into two parts to find the z score for the given percentage.
Complete step by step solution:
We have to find the Z score for \[95\%\].
We know that to obtain the value for the given percentage, we have to refer to the area under the Normal distribution table.
We know that the area under the normal curve represents total probability, which is equal to 1 at two extreme values \[z=\infty \] and \[z=-\infty \].
We can see that the area of one half of the area is 0.5 and the value of z exactly at the middle is 0.
We know that on one side, we have 0.5, so the remaining half will be,
\[\Rightarrow 1-0.5=0.45\]
Now we have to find the z value for 0.45, we can move along the area in the table and locate the nearest value. It will be 0.4505 in the table.
We will see a value in the z column if we move left in the table, which will be 1.6.
We can then move vertically up and reach the top most row in the table, we will find 0.05.
We can now add these values we get,
\[\Rightarrow 1.6+0.05=1.65\]
Therefore, the Z score of \[95\%\] is 1.65.

Note: Students make mistakes while drawing the area under the normal curve and plotting the correct points over there. We should always remember that We know that the area under the normal curve represents total probability, which is equal to 1 at two extreme values \[z=\infty \] and \[z=-\infty \]. We can see that the area of one half of the area is 0.5 and the value of z exactly at the middle is 0.
Complete step by step solution:
We have to find the Z score for \[95\%\].
We know that to obtain the value for the given percentage, we have to refer to the area under the Normal distribution table.
We know that the area under the normal curve represents total probability, which is equal to 1 at two extreme values \[z=\infty \] and \[z=-\infty \].
We can see that the area of one half of the area is 0.5 and the value of z exactly at the middle is 0.
We know that on one side, we have 0.5, so the remaining half will be,
\[\Rightarrow 1-0.5=0.45\]
Now we have to find the z value for 0.45, we can move along the area in the table and locate the nearest value. It will be 0.4505 in the table.
We will see a value in the z column if we move left in the table, which will be 1.6.
We can then move vertically up and reach the top most row in the table, we will find 0.05.
We can now add these values we get,
\[\Rightarrow 1.6+0.05=1.65\]
Therefore, the Z score of \[95\%\] is 1.65.

Note: Students make mistakes while drawing the area under the normal curve and plotting the correct points over there. We should always remember that We know that the area under the normal curve represents total probability, which is equal to 1 at two extreme values \[z=\infty \] and \[z=-\infty \]. We can see that the area of one half of the area is 0.5 and the value of z exactly at the middle is 0.
Recently Updated Pages
Master Class 11 Computer Science: Engaging Questions & Answers for Success

Master Class 11 Business Studies: Engaging Questions & Answers for Success

Master Class 11 Economics: Engaging Questions & Answers for Success

Master Class 11 English: Engaging Questions & Answers for Success

Master Class 11 Maths: Engaging Questions & Answers for Success

Master Class 11 Biology: Engaging Questions & Answers for Success

Trending doubts
One Metric ton is equal to kg A 10000 B 1000 C 100 class 11 physics CBSE

There are 720 permutations of the digits 1 2 3 4 5 class 11 maths CBSE

Discuss the various forms of bacteria class 11 biology CBSE

Draw a diagram of a plant cell and label at least eight class 11 biology CBSE

State the laws of reflection of light

Explain zero factorial class 11 maths CBSE


