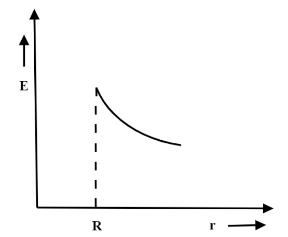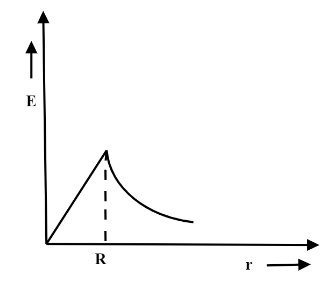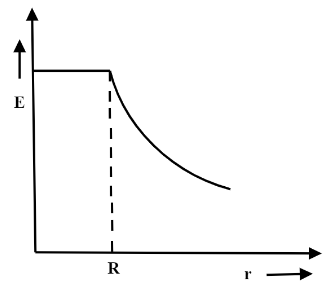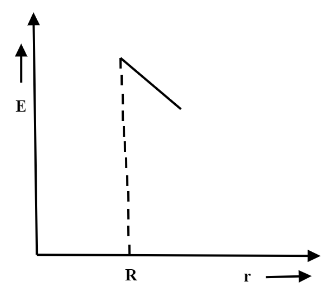
Which of the following graphs shows the variation of electric field strength E with distance r from the centre of a hollow conducting sphere?
(A)

(B)

(C)

(D)


Answer
478.5k+ views
Hint: The electric field inside the sphere is zero, while the electric field outside the sphere is equal to the field from a point charge with a net charge of Q, according to Gauss' law. Inside a conducting sphere, the electric field is zero. Outside the sphere the field will decrease rapidly.
Complete Step By Step Answer:
The electric field inside a uniformly charged conducting sphere is E=0, which means there is no charge inside the conductor.
Inside the hollow conducting sphere, the electric field is zero. Outside the sphere the electric field $ E = \dfrac{{kq}}{{{r^2}}} $ , so the graph decreases uniformly.
Because the charge inside the gaussian surface is zero. As a result, E is also zero inside the gaussian surface. When the electric charge dispersion is known and the electric field must be registered, the issue is substantially more difficult. There will be no net charge inside the Gaussian surface if any hypothetical sphere is placed within the charged sphere. q = 0 is the result. As a result, the net flux is equal to zero. So, inside a hollow sphere, the electric field is zero.
The correct answer is option A.
Note:
The electric field inside the sphere is inversely proportional to the square of the distance from the centre, this is true until reaching the surface. Outside the surface the field vanishes more rapidly with distance. The decrease is not in a linear manner.
Recently Updated Pages
Master Class 12 Economics: Engaging Questions & Answers for Success

Master Class 12 Physics: Engaging Questions & Answers for Success

Master Class 12 English: Engaging Questions & Answers for Success

Master Class 12 Social Science: Engaging Questions & Answers for Success

Master Class 12 Maths: Engaging Questions & Answers for Success

Master Class 12 Business Studies: Engaging Questions & Answers for Success

Trending doubts
Which are the Top 10 Largest Countries of the World?

What are the major means of transport Explain each class 12 social science CBSE

Draw a labelled sketch of the human eye class 12 physics CBSE

Why cannot DNA pass through cell membranes class 12 biology CBSE

Differentiate between insitu conservation and exsitu class 12 biology CBSE

Draw a neat and well labeled diagram of TS of ovary class 12 biology CBSE


