


Which of the following lines correctly shows the temperature dependence of equilibrium constant, K, for an exothermic reaction?
(A) C and D
(B) A and D
(C) A and B
(D) B and C
Answer
532.2k+ views
Hint: To solve this question, we first need to derive an equation that gives the relation between the equilibrium constant of a reaction and the temperature of the reaction.
Since the change in Gibbs free energy can be related to both equilibrium constant and temperature, it can be used to derive the equation relating r=equilibrium constant and temperature.
Complete answer:
The relation between Gibbs free energy and the equilibrium constant K is given by the following equation
\[\Delta G{}^\circ =-RT\ln K\]
Where \[\Delta G{}^\circ \] gives the change in Gibbs free energy, the equilibrium constant is given by K, the reaction of the temperature is given by T and R is the gas constant having value 8.314J/mol.K
Also, we know that when there is no change in the temperature of the reaction, the change in Gibbs free energy is given by
\[\Delta G{}^\circ =\Delta H{}^\circ -T\Delta S{}^\circ \]
Where the change in enthalpy of the system is given by \[\Delta H{}^\circ \] and change in the entropy of the system is given by \[\Delta S{}^\circ \].
So, we can say that
\[\begin{align}
& \Delta H{}^\circ -T\Delta S{}^\circ =RT\ln K \\
& \ln K=\dfrac{-\Delta H{}^\circ }{RT}+\dfrac{\Delta S{}^\circ }{R} \\
\end{align}\]
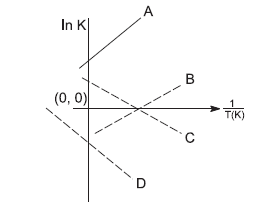
If a graph is plotted between lnK and $\dfrac{1}{T}$, the slope would be given by $\dfrac{-\Delta H{}^\circ }{R}$.
Now, it is given to us that the reaction is exothermic.
Since during an exothermic reaction heat is released, the enthalpy \[\Delta H{}^\circ \] of the reaction is negative.
Hence the slope of the graph lnK vs $\dfrac{1}{T}$ is positive.
Since in the graph the given slope is positive only for lines A and B, hence the correct dependence of equilibrium constant on temperature is shown by the lines option (C) A and B.
Note:
It should be noted that in the given graph, lines C and D have negative slopes. From this, we can say that it has a negative value of $\dfrac{-\Delta H{}^\circ }{R}$ and so the change in enthalpy $\Delta H{}^\circ $ is positive. Hence the reactions corresponding to lines C and D are endothermic.
Since the change in Gibbs free energy can be related to both equilibrium constant and temperature, it can be used to derive the equation relating r=equilibrium constant and temperature.
Complete answer:
The relation between Gibbs free energy and the equilibrium constant K is given by the following equation
\[\Delta G{}^\circ =-RT\ln K\]
Where \[\Delta G{}^\circ \] gives the change in Gibbs free energy, the equilibrium constant is given by K, the reaction of the temperature is given by T and R is the gas constant having value 8.314J/mol.K
Also, we know that when there is no change in the temperature of the reaction, the change in Gibbs free energy is given by
\[\Delta G{}^\circ =\Delta H{}^\circ -T\Delta S{}^\circ \]
Where the change in enthalpy of the system is given by \[\Delta H{}^\circ \] and change in the entropy of the system is given by \[\Delta S{}^\circ \].
So, we can say that
\[\begin{align}
& \Delta H{}^\circ -T\Delta S{}^\circ =RT\ln K \\
& \ln K=\dfrac{-\Delta H{}^\circ }{RT}+\dfrac{\Delta S{}^\circ }{R} \\
\end{align}\]
If a graph is plotted between lnK and $\dfrac{1}{T}$, the slope would be given by $\dfrac{-\Delta H{}^\circ }{R}$.
Now, it is given to us that the reaction is exothermic.
Since during an exothermic reaction heat is released, the enthalpy \[\Delta H{}^\circ \] of the reaction is negative.
Hence the slope of the graph lnK vs $\dfrac{1}{T}$ is positive.
Since in the graph the given slope is positive only for lines A and B, hence the correct dependence of equilibrium constant on temperature is shown by the lines option (C) A and B.
Note:
It should be noted that in the given graph, lines C and D have negative slopes. From this, we can say that it has a negative value of $\dfrac{-\Delta H{}^\circ }{R}$ and so the change in enthalpy $\Delta H{}^\circ $ is positive. Hence the reactions corresponding to lines C and D are endothermic.
Recently Updated Pages
Master Class 12 Economics: Engaging Questions & Answers for Success
Master Class 12 Physics: Engaging Questions & Answers for Success
Master Class 12 English: Engaging Questions & Answers for Success
Master Class 12 Social Science: Engaging Questions & Answers for Success
Master Class 12 Maths: Engaging Questions & Answers for Success
Master Class 12 Business Studies: Engaging Questions & Answers for Success
Trending doubts
Which are the Top 10 Largest Countries of the World?
What are the major means of transport Explain each class 12 social science CBSE
Draw a labelled sketch of the human eye class 12 physics CBSE
Why cannot DNA pass through cell membranes class 12 biology CBSE
Differentiate between insitu conservation and exsitu class 12 biology CBSE
Draw a neat and well labeled diagram of TS of ovary class 12 biology CBSE