


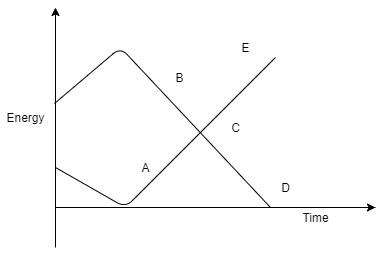
The graph below shows potential energy and kinetic energy plotted against time of a ball thrown straight up from the 10 storey building. At what point on the graph does the potential energy of the object equal the kinetic energy of the object?
a) A
b) B
c) C
d) D
e) E
Answer
233.1k+ views
Hint: The total mechanical energy in a system remains constant if the external work done is zero. In such a system, where an initial work done is applied, that is needed to be added to the total mechanical energy of the system if throughout the motion no other external work is done. As the ball is thrown up it first gets up and then goes down from the $10$ storey building. Accordingly, the potential and kinetic energy changes along with the progress of the event in time.
Complete step by step answer:
Step 1:
Initially the ball was at the $10$ storey building, hence, it possesses some potential energy. Now when the ball is thrown upwards it gets a good amount of kinetic energy due to the velocity with which the ball is thrown. Then as the ball goes up the gravity acts on it and the velocity of the ball reduces with time and hence eventually the kinetic energy of the ball starts decreasing. However, with the increase in height of the ball, the potential energy of the ball increases with time.
Then at the highest height, when the gravity has its maximum effect on the ball, the velocity of the ball decelerates to zero and hence the kinetic energy decreases to zero. Eventually, with the maximum attained height the potential energy becomes the maximum.
So, you can see that the points A, B cannot have the same amount of potential energy and the kinetic energy with time.
Step 2:
As the ball reaches the topmost floating point, the ball starts gradually falling downwards. So now the scenario changes with time.
The ball starts to attain an acceleration towards the ground only to attain the same velocity at the starting point from where the ball was thrown. Then with time you can see as the ball falls, the velocity of the ball increases and the kinetic energy of the ball increases. But with the decrease in height, the potential energy of the ball continuously decreases with time.
Thus, at a point C in the graph we can see where the potential energy curve and the kinetic energy curve intersects to meet at the point C. We get to see from the graph that the kinetic and potential energy become just the same to each other.
So, C is the expected point.
Step 3:
At D and E point we can understand that as the ball touches the ground its potential energy becomes zero and the kinetic energy attains its maximum.
Hence, D or E cannot be the correct choice.
On the graph the potential energy of the object equals the kinetic energy of the object at the point (C) C.
Note: The total mechanical energy of any system should be conserved. Here, the total mechanical energy should be started calculating from the instant the ball is thrown upwards. This is essential to understand that while throwing the ball upwards, an external force is applied hence an extra amount of energy is included in the system. Then the graphs of the potential energy and the kinetic energy will generally change inversely to each other as the total energy should be conserved. You can see from any point other than C the ordinate values are different for the potential and kinetic energies. Only at C, the plot is in the midpoint where the potential energy and the kinetic energy are equal to each other.
Recently Updated Pages
JEE Main 2023 April 6 Shift 1 Question Paper with Answer Key
JEE Main 2023 April 6 Shift 2 Question Paper with Answer Key
JEE Main 2023 (January 31 Evening Shift) Question Paper with Solutions [PDF]
JEE Main 2023 January 30 Shift 2 Question Paper with Answer Key
JEE Main 2023 January 25 Shift 1 Question Paper with Answer Key
JEE Main 2023 January 24 Shift 2 Question Paper with Answer Key
Trending doubts
JEE Main 2026: Session 2 Registration Open, City Intimation Slip, Exam Dates, Syllabus & Eligibility
JEE Main 2026 Application Login: Direct Link, Registration, Form Fill, and Steps
JEE Main Marking Scheme 2026- Paper-Wise Marks Distribution and Negative Marking Details
Understanding the Angle of Deviation in a Prism
Hybridisation in Chemistry – Concept, Types & Applications
How to Convert a Galvanometer into an Ammeter or Voltmeter
Other Pages
JEE Advanced Marks vs Ranks 2025: Understanding Category-wise Qualifying Marks and Previous Year Cut-offs
Laws of Motion Class 11 Physics Chapter 4 CBSE Notes - 2025-26
Waves Class 11 Physics Chapter 14 CBSE Notes - 2025-26
Mechanical Properties of Fluids Class 11 Physics Chapter 9 CBSE Notes - 2025-26
Thermodynamics Class 11 Physics Chapter 11 CBSE Notes - 2025-26
Units And Measurements Class 11 Physics Chapter 1 CBSE Notes - 2025-26