


A sub-divided bar diagram is used to present data having 2 or more components. Give reasons.
Answer
524.6k+ views
Hint: A sub-divided bar diagram is used to present data having 2 or more components. Sub-divided or component bar chart is used to represent data in which the total magnitude is divided into different or components. Draw the sub-divided bar graph of a data of your choice with 2 or more input data.
Complete step-by-step answer:
It is given that a sub-divided bar diagram is used to present data having 2 or more components. Let’s see when sub-divided bar diagram is used. Sub-divided or component bar chart is used to represent data in which the total magnitude is divided into different or components.
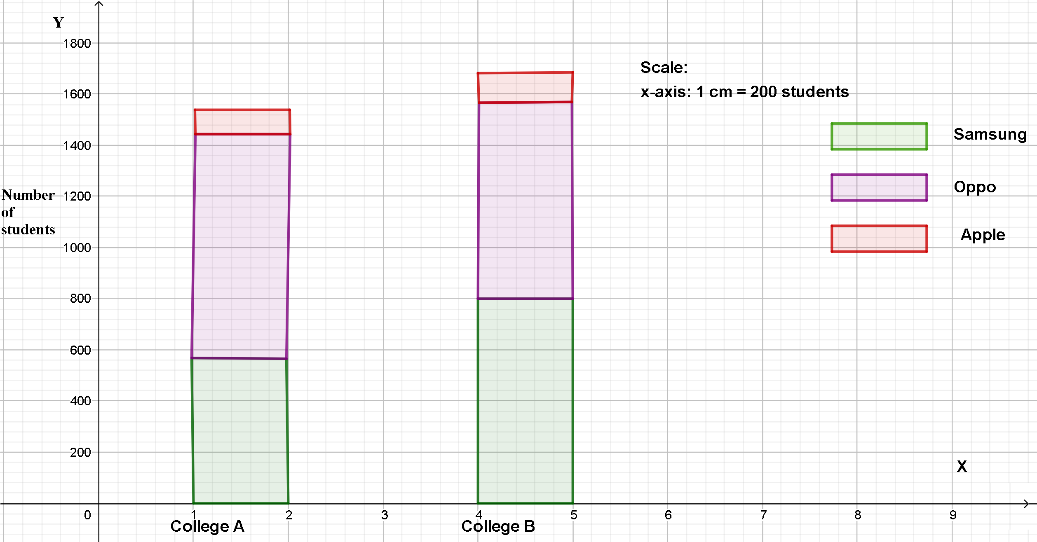
Let us understand this through an example. Consider the data given below. The data shows the number of students in college A and college B that use mobile phones from Samsung, Oppo and Apple.
We can see that there are multiple data from college A and college B. We can draw the graph by first making simple bars for each class by taking the total magnitude in that class. We then divide these simple bars into parts in the ratio of various components.
We can see that for college A, the total magnitude is $590+880+100=1570$ . We then divide these according to the given data.
From the data of college B, we can see that the total magnitude is $800+750+150=1700$ .
Hence, a sub-divided bar diagram is used to present data having 2 or more components.
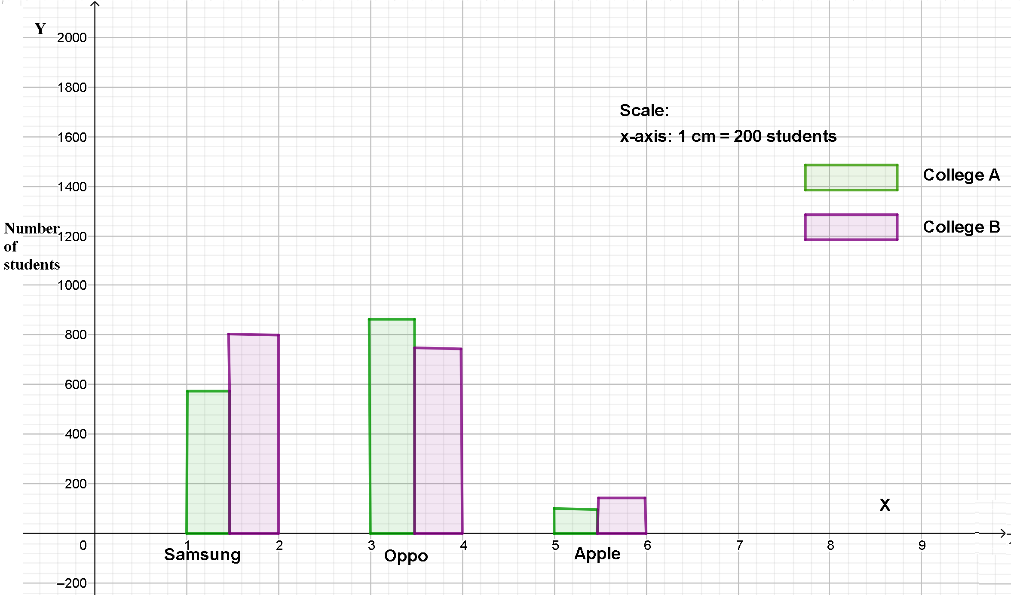
Note: You may get mixed up with sub-division bar graph and double-bar graph or triple-bar diagram. We also use double or triple-bar graph to show 2 or more components but in a different way. In the sub-division bar graph, we had the colleges in the X-axis and we took the total magnitude and divided it among the brands. But in a double-bar graph, we will have the brands in X-axis. It is shown below.
Complete step-by-step answer:
It is given that a sub-divided bar diagram is used to present data having 2 or more components. Let’s see when sub-divided bar diagram is used. Sub-divided or component bar chart is used to represent data in which the total magnitude is divided into different or components.
Let us understand this through an example. Consider the data given below. The data shows the number of students in college A and college B that use mobile phones from Samsung, Oppo and Apple.
| Products | Number of Students | |
| College A | College B | |
| Samsung | 590 | 800 |
| Oppo | 880 | 750 |
| Apple | 100 | 150 |
We can see that there are multiple data from college A and college B. We can draw the graph by first making simple bars for each class by taking the total magnitude in that class. We then divide these simple bars into parts in the ratio of various components.
We can see that for college A, the total magnitude is $590+880+100=1570$ . We then divide these according to the given data.
From the data of college B, we can see that the total magnitude is $800+750+150=1700$ .
Hence, a sub-divided bar diagram is used to present data having 2 or more components.
Note: You may get mixed up with sub-division bar graph and double-bar graph or triple-bar diagram. We also use double or triple-bar graph to show 2 or more components but in a different way. In the sub-division bar graph, we had the colleges in the X-axis and we took the total magnitude and divided it among the brands. But in a double-bar graph, we will have the brands in X-axis. It is shown below.
Recently Updated Pages
Master Class 11 Computer Science: Engaging Questions & Answers for Success
Master Class 11 Business Studies: Engaging Questions & Answers for Success
Master Class 11 Economics: Engaging Questions & Answers for Success
Master Class 11 English: Engaging Questions & Answers for Success
Master Class 11 Maths: Engaging Questions & Answers for Success
Master Class 11 Biology: Engaging Questions & Answers for Success
Trending doubts
One Metric ton is equal to kg A 10000 B 1000 C 100 class 11 physics CBSE
There are 720 permutations of the digits 1 2 3 4 5 class 11 maths CBSE
Discuss the various forms of bacteria class 11 biology CBSE
Draw a diagram of a plant cell and label at least eight class 11 biology CBSE
State the laws of reflection of light
Explain zero factorial class 11 maths CBSE