


Distinguish between frequency polygon and frequency curve.
Answer
581.4k+ views
Hint: We will first look at the definition of a frequency polygon and a frequency curve. Then we will look at how to draw a frequency polygon and a frequency curve from a histogram. We will see an example to demonstrate the difference between the frequency polygon and the frequency curve.
Complete step by step answer:
A frequency polygon is a graph constructed by using lines to join the midpoints of each interval/ The midpoint is also called as the class mark of that particular class. It is calculated as $\dfrac{\text{upper limit + lower limit}}{2}$.
A frequency curve is a limiting form of a histogram or a frequency polygon. A frequency curve for a given distribution can be obtained by drawing a smooth, free hand curve through the midpoints of the upper sides of the rectangles forming the histogram.
Let us consider an example. Consider the following table:
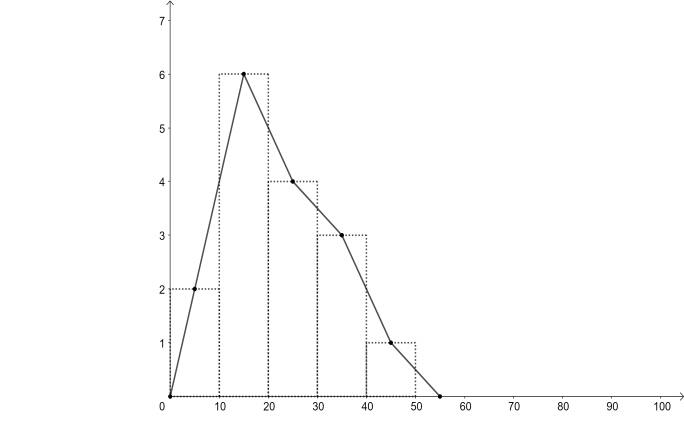
For the example we have considered, a frequency polygon looks like the following,
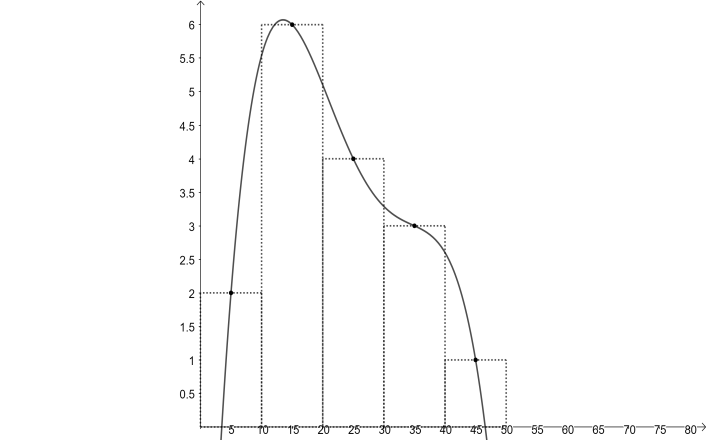
And for the same example, a frequency curve looks like the following,
We can see that the frequency polygon and the frequency curve, both depend on the class mark to be expressed as graphs.
The only difference between a frequency polygon and a frequency curve is the following,
A frequency curve is a smooth, free hand drawn curve.
A frequency polygon is drawn by joining the class marks with line segments.
Note:
The information given about grouped data and its frequencies can be represented in more than one way. The frequency curve can be drawn from the frequency polygon. The area under the frequency polygon is equal to the area of the histogram. This area tells us the frequency values that would be displayed in the distribution table.
Complete step by step answer:
A frequency polygon is a graph constructed by using lines to join the midpoints of each interval/ The midpoint is also called as the class mark of that particular class. It is calculated as $\dfrac{\text{upper limit + lower limit}}{2}$.
A frequency curve is a limiting form of a histogram or a frequency polygon. A frequency curve for a given distribution can be obtained by drawing a smooth, free hand curve through the midpoints of the upper sides of the rectangles forming the histogram.
Let us consider an example. Consider the following table:
| Classes | 0-10 | 10-20 | 20-30 | 30-40 | 40-50 |
| Class mark | 5 | 15 | 25 | 35 | 45 |
| Frequencies | 2 | 6 | 4 | 3 | 1 |
For the example we have considered, a frequency polygon looks like the following,
And for the same example, a frequency curve looks like the following,
We can see that the frequency polygon and the frequency curve, both depend on the class mark to be expressed as graphs.
The only difference between a frequency polygon and a frequency curve is the following,
A frequency curve is a smooth, free hand drawn curve.
A frequency polygon is drawn by joining the class marks with line segments.
Note:
The information given about grouped data and its frequencies can be represented in more than one way. The frequency curve can be drawn from the frequency polygon. The area under the frequency polygon is equal to the area of the histogram. This area tells us the frequency values that would be displayed in the distribution table.
Recently Updated Pages
Master Class 10 Computer Science: Engaging Questions & Answers for Success
Master Class 10 General Knowledge: Engaging Questions & Answers for Success
Master Class 10 English: Engaging Questions & Answers for Success
Master Class 10 Social Science: Engaging Questions & Answers for Success
Master Class 10 Maths: Engaging Questions & Answers for Success
Master Class 10 Science: Engaging Questions & Answers for Success
Trending doubts
What is the median of the first 10 natural numbers class 10 maths CBSE
Which women's tennis player has 24 Grand Slam singles titles?
Who is the Brand Ambassador of Incredible India?
Why is there a time difference of about 5 hours between class 10 social science CBSE
Write a letter to the principal requesting him to grant class 10 english CBSE
A moving boat is observed from the top of a 150 m high class 10 maths CBSE