


Draw a Histogram for the following data :
Class Interval Frequency 0 − 10 35 10 − 20 70 20 − 30 20 30 − 40 40 40 − 50 50
| Class Interval | Frequency |
| 0 − 10 | 35 |
| 10 − 20 | 70 |
| 20 − 30 | 20 |
| 30 − 40 | 40 |
| 40 − 50 | 50 |
Answer
546.3k+ views
Hint: To draw a histogram firstly we should observe the data given. In the above question here we have five class intervals as 0 − 10, 10 − 20, 20 − 30, 30 − 40 and 40 – 50 having the frequencies as 35, 70, 20, 40 and 50 respectively. Plot these data to obtain the Histogram.
Complete step-by-step answer:
Here we have the given data as follows,
Now plot each of the class intervals given in the question in horizontal axis and their respective frequencies along with it in vertical axis. Here we have class intervals as 0 − 10, 10 − 20, 20 − 30, 30 − 40 and 40 – 50 having the frequencies as 35, 70, 20, 40 and 50 respectively.
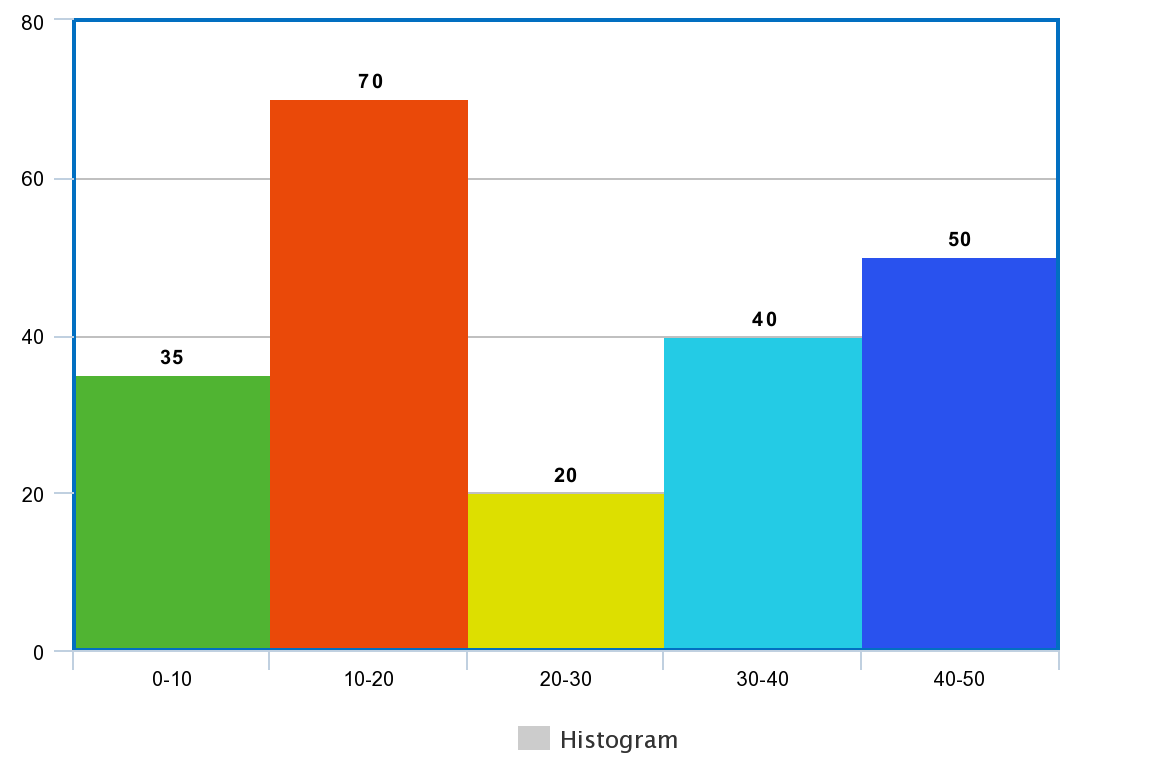
The plot shown above is the required histogram
Note: It is required for the student to have the knowledge of potting the data from the given information in the question to get the required histogram and the student should be aware of the rules and steps to be followed while plotting the histogram using the given data.
Complete step-by-step answer:
Here we have the given data as follows,
| Class Interval | Frequency |
| 0 − 10 | 35 |
| 10 − 20 | 70 |
| 20 − 30 | 20 |
| 30 − 40 | 40 |
| 40 − 50 | 50 |
Now plot each of the class intervals given in the question in horizontal axis and their respective frequencies along with it in vertical axis. Here we have class intervals as 0 − 10, 10 − 20, 20 − 30, 30 − 40 and 40 – 50 having the frequencies as 35, 70, 20, 40 and 50 respectively.
The plot shown above is the required histogram
Note: It is required for the student to have the knowledge of potting the data from the given information in the question to get the required histogram and the student should be aware of the rules and steps to be followed while plotting the histogram using the given data.
Recently Updated Pages
Master Class 11 Computer Science: Engaging Questions & Answers for Success
Master Class 11 Business Studies: Engaging Questions & Answers for Success
Master Class 11 Economics: Engaging Questions & Answers for Success
Master Class 11 English: Engaging Questions & Answers for Success
Master Class 11 Maths: Engaging Questions & Answers for Success
Master Class 11 Biology: Engaging Questions & Answers for Success
Trending doubts
One Metric ton is equal to kg A 10000 B 1000 C 100 class 11 physics CBSE
There are 720 permutations of the digits 1 2 3 4 5 class 11 maths CBSE
Discuss the various forms of bacteria class 11 biology CBSE
Draw a diagram of a plant cell and label at least eight class 11 biology CBSE
State the laws of reflection of light
Explain zero factorial class 11 maths CBSE