


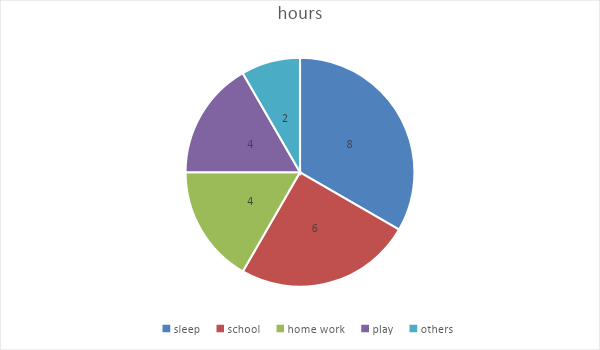
Draw a pie chart of the data given below: the time spent by a child during a day:
Activities Time spent Sleep 8 hrs School 6 hrs Homework 4 hrs Play 4 hrs Others 2 hrs
| Activities | Time spent |
| Sleep | 8 hrs |
| School | 6 hrs |
| Homework | 4 hrs |
| Play | 4 hrs |
| Others | 2 hrs |
Answer
575.4k+ views
Hint: Pie chart is pictorial form of showing data in given proportion. In the pie chart each section of it is drawn according to their proportion coming in a given set of data.
This set of data is converted into area of circle in terms of angle of circle.
Complete step-by-step answer:
1.First calculate the total time spent by a child in a day. That is,
${l}
= 8 + 6 + 4 + 4 + 2\\
= 24\,{\rm{hrs}}
$
2. Determine the area for each activity in the pie chart. It is the ratio of time spent on each activity to the total time in a day.
This ratio is converted to circle area by multiplying with $360^\circ $ because the angle of the circle is $360^\circ $.
Sleep = 8 hrs
${l}
= \dfrac{8}{{24}} \times 360\\
= 120^\circ
$
School = 6 hrs
${l}
= \dfrac{6}{{24}} \times 360\\
= 90^\circ
$
Homework = 4 hrs
${l}
= \dfrac{4}{{24}} \times 360\\
= 60^\circ
$
Play = 4 hrs
${l}
= \dfrac{4}{{24}} \times 360\\
= 60^\circ
$
Others = 2 hrs
${l}
= \dfrac{2}{{24}} \times 360\\
= 30^\circ
$
3. From the above step we determine the angle for each activity done by a child in a day, for further procedure you have to draw a circle.
4. Draw a baseline in this circle which passes through the centre.
5. Now, measure angles one by one for each activity with the help of a protractor.
6. after measuring the angles of them draw the line and join them with the periphery of the circle.
7. We can write the name of activity in each section of the pie chart for better understanding with their angle measurement.
Note: Remember that the ratio of time for an activity should be multiplied by the angle of the circle for changing it into degrees of circle. It is necessary to make the pie chart.
Recently Updated Pages
Master Class 10 Computer Science: Engaging Questions & Answers for Success
Master Class 10 General Knowledge: Engaging Questions & Answers for Success
Master Class 10 English: Engaging Questions & Answers for Success
Master Class 10 Social Science: Engaging Questions & Answers for Success
Master Class 10 Maths: Engaging Questions & Answers for Success
Master Class 10 Science: Engaging Questions & Answers for Success
Trending doubts
What is the median of the first 10 natural numbers class 10 maths CBSE
Which women's tennis player has 24 Grand Slam singles titles?
Who is the Brand Ambassador of Incredible India?
Why is there a time difference of about 5 hours between class 10 social science CBSE
Write a letter to the principal requesting him to grant class 10 english CBSE
A moving boat is observed from the top of a 150 m high class 10 maths CBSE