


Draw the graph of function ${{\sin }^{-1}}\left( x \right)$ .
Answer
602.7k+ views
Hint: We should know that the range of ${{\sin }^{-1}}\left( x \right)$ function is $1-to-1$ . This when converted to radian form comes in the range of ${{\sin }^{-1}}1={{\sin }^{-1}}\left( {{90}^{\circ }} \right)=\dfrac{\pi }{2}$ . So, the range becomes $\left[ -\dfrac{\pi }{2},\dfrac{\pi }{2} \right]$ from minimum to maximum. So, while drawing the graph, take functions as $y={{\sin }^{-1}}\left( x \right)$ . Therefore, the graph will be along the y-axis.
Complete step-by-step answer:
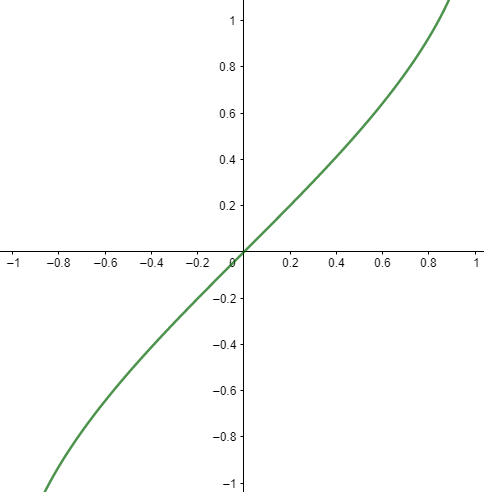
Now, here we have to draw graph of $f\left( x \right)={{\sin }^{-1}}\left( x \right)$
Trigonometric functions are periodic functions. Thus, the graphs of none of them pass the horizontal line test. This means none of them have an inverse unless the domain of each trigonometric function is restricted to make each of them $1-to-1$ . We call the domain the range of the function.
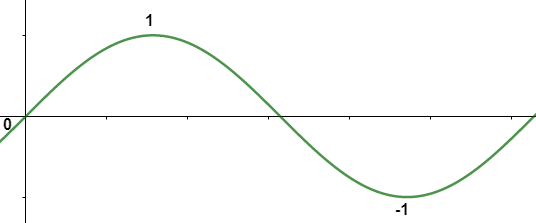
If we restrict the domain of $f\left( x \right)=\sin \left( x \right)$ to $\left[ -\dfrac{\pi }{2},\dfrac{\pi }{2} \right]$ , we have made the function $1-to-1$ . So, the range is $\left[ -1,1 \right]$ .
Now, we denote the inverse function as $y={{\sin }^{-1}}\left( x \right)$ . It is read as y is inverse of $\sin x$ means y is the real number angle whose sine value is x.
Therefore, the graph of $y={{\sin }^{-1}}\left( x \right)$ is as shown below:
Note: Be careful while using the notation used. The superscript $-1$ is not an exponent. To avoid this, somewhere it is denoted as $y=arc\sin \left( x \right)$ instead. Also, notice that the domain is now the range and range is now domain. Because the domain is restricted to all positive values will be in the first quadrant and all negative values will be in the fourth quadrant. We should know the range of function $f\left( x \right)=\sin \left( x \right)$ along with this range of this function which is given as $\left[ 0,1 \right]$ for positive values by finding value of function at different value of $\theta $ . So, by getting this, we get the graph for all the values of $\theta $ .
Complete step-by-step answer:
Now, here we have to draw graph of $f\left( x \right)={{\sin }^{-1}}\left( x \right)$
Trigonometric functions are periodic functions. Thus, the graphs of none of them pass the horizontal line test. This means none of them have an inverse unless the domain of each trigonometric function is restricted to make each of them $1-to-1$ . We call the domain the range of the function.
If we restrict the domain of $f\left( x \right)=\sin \left( x \right)$ to $\left[ -\dfrac{\pi }{2},\dfrac{\pi }{2} \right]$ , we have made the function $1-to-1$ . So, the range is $\left[ -1,1 \right]$ .
Now, we denote the inverse function as $y={{\sin }^{-1}}\left( x \right)$ . It is read as y is inverse of $\sin x$ means y is the real number angle whose sine value is x.
Therefore, the graph of $y={{\sin }^{-1}}\left( x \right)$ is as shown below:
Note: Be careful while using the notation used. The superscript $-1$ is not an exponent. To avoid this, somewhere it is denoted as $y=arc\sin \left( x \right)$ instead. Also, notice that the domain is now the range and range is now domain. Because the domain is restricted to all positive values will be in the first quadrant and all negative values will be in the fourth quadrant. We should know the range of function $f\left( x \right)=\sin \left( x \right)$ along with this range of this function which is given as $\left[ 0,1 \right]$ for positive values by finding value of function at different value of $\theta $ . So, by getting this, we get the graph for all the values of $\theta $ .
Recently Updated Pages
Master Class 12 Economics: Engaging Questions & Answers for Success
Master Class 12 Physics: Engaging Questions & Answers for Success
Master Class 12 English: Engaging Questions & Answers for Success
Master Class 12 Social Science: Engaging Questions & Answers for Success
Master Class 12 Maths: Engaging Questions & Answers for Success
Master Class 12 Business Studies: Engaging Questions & Answers for Success
Trending doubts
Why cannot DNA pass through cell membranes class 12 biology CBSE
Draw a neat and well labeled diagram of TS of ovary class 12 biology CBSE
In a human foetus the limbs and digits develop after class 12 biology CBSE
AABbCc genotype forms how many types of gametes a 4 class 12 biology CBSE
Differentiate between homogeneous and heterogeneous class 12 chemistry CBSE
The correct structure of ethylenediaminetetraacetic class 12 chemistry CBSE