


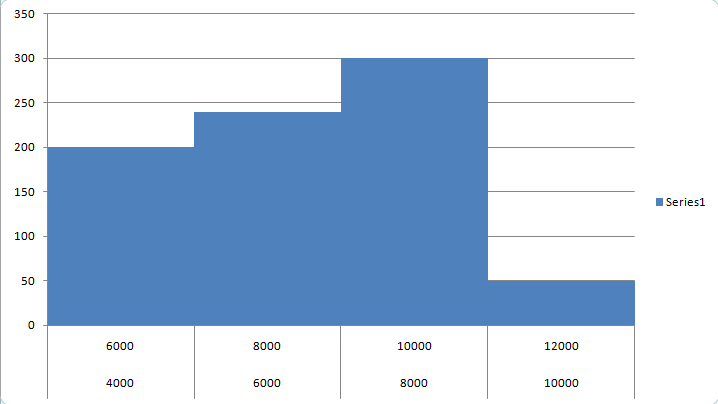
Draw the histogram and use it to find the mode for the following frequency distribution .
House - Rent in Rs per month $4000 - 6000$ $6000 - 8000$ $8000 - 10000$ $10000 - 12000$ Number of families $200$ $240$ $300$ $50$
A) Rs $8000$
B) Rs $8350$
C) Rs $8500$
D) Rs $8750$
| House - Rent in Rs per month | $4000 - 6000$ | $6000 - 8000$ | $8000 - 10000$ | $10000 - 12000$ |
| Number of families | $200$ | $240$ | $300$ | $50$ |
Answer
577.8k+ views
Hint:
First draw the histogram , A histogram is a bar graph which shows frequency distributions among the given data it is similar to bar graph but it do not have space between them after finding this , we know that the mode of the grouped data is Estimated mode = $L + \dfrac{{{f_m} - {f_{m - 1}}}}{{({f_m} - {f_{m - 1}}) + ({f_m} - {f_{m + 1}})}} \times w$Modal group is the group which have maximum frequency where L is the lower class boundary of the modal group ${f_{m - 1}}$ is the frequency of the group before the modal group ${f_m}$ is the frequency of the modal group ${f_{m + 1}}$ is the frequency of the group after the modal group w is the group width .
Complete step by step solution:
First we have to draw the histogram of the given data , A histogram is a bar graph-like representation of data that buckets a range of outcomes into columns along the x-axis and in the y-axis represents the number count or percentage of occurrences in the data for each column and can be used to visualize data distributions in bar graph there is having space between them while in histogram no space will occur ,
So histogram of the given data is
Now we have to find out the mode of the given data for this we know that the formula mode of grouped data is
Mode is the number that appears most frequently in a data set . In the grouped data we use the formula for mode that is ,
Estimated mode = $L + \dfrac{{{f_m} - {f_{m - 1}}}}{{({f_m} - {f_{m - 1}}) + ({f_m} - {f_{m + 1}})}} \times w$
Modal group is the group which has maximum frequency .
where L is the lower class boundary of the modal group
${f_{m - 1}}$ is the frequency of the group before the modal group
${f_m}$ is the frequency of the modal group
${f_{m + 1}}$ is the frequency of the group after the modal group
w is the group width .
For the given question
Modal Group is $8000 - 10000$
L = $8000$ (is the lower class boundary of the modal group)
${f_{m - 1}} = 240$ (is the frequency of the group before the modal group)
${f_m} = 300$ (is the frequency of the modal group)
${f_{m + 1}} = 50$ (is the frequency of the group after the modal group)
w = $2000$ (is the group width)
Now putting these values in the given Estimated mode equation ,
Mode = $8000 + \dfrac{{300 - 240}}{{(300 - 240) + (300 - 50)}} \times 2000$
= $8000 + \dfrac{{60}}{{60 + 250}} \times 2000$
= $8000 + \dfrac{{60}}{{310}} \times 2000$
After solving there values we get,
=$ 8387.096$
Hence it means that the mode of this data is closer to this data on seeing the option , The option B is more closer to this data hence it will be our correct answer.
Note:
For the mean of grouped data Mean = $\dfrac{{\sum {f \times } X}}{{\sum f }}$ where X is the midpoint of the group and f is frequency of that data .
For Median of the group data we use formula Median = $ = L + \dfrac{{\dfrac{n}{2} - B}}{G} \times w$ where: L is the lower class boundary of the group containing the median , n is the total number of values , B is the cumulative frequency of the groups before the median group, G is the frequency of the median group ,w is the group width.
Recently Updated Pages
Master Class 10 Computer Science: Engaging Questions & Answers for Success
Master Class 10 General Knowledge: Engaging Questions & Answers for Success
Master Class 10 English: Engaging Questions & Answers for Success
Master Class 10 Social Science: Engaging Questions & Answers for Success
Master Class 10 Maths: Engaging Questions & Answers for Success
Master Class 10 Science: Engaging Questions & Answers for Success
Trending doubts
What is the median of the first 10 natural numbers class 10 maths CBSE
Which women's tennis player has 24 Grand Slam singles titles?
Who is the Brand Ambassador of Incredible India?
Why is there a time difference of about 5 hours between class 10 social science CBSE
Write a letter to the principal requesting him to grant class 10 english CBSE
A moving boat is observed from the top of a 150 m high class 10 maths CBSE