


Find the central angle of the pie chart for winter.
Season Number of Votes Summer 90 Rainy 120 Winter 150
(a) 90
(b) 120
(c) 150
(d) None of these
| Season | Number of Votes |
| Summer | 90 |
| Rainy | 120 |
| Winter | 150 |
Answer
597.9k+ views
Hint: In this question, first of all, find the total votes by adding all three number of votes. Now, to find the central angle of any season, divide the votes of that season by total votes and multiply the ratio by \[{{360}^{\circ }}.\]
Complete step-by-step answer:
In this question, by using the following table, we have to find the central angle of winter.
We know that the pie chart is basically a type of graph in which a circle is divided into sectors that each represent a proportion of the whole.
Let us find the total number of votes. So, we get,
Total votes = (Number of votes of Summer season + (Number of votes of Rainy Season) + (Number of votes of Winter Season)
By substituting the values from the table, we get,
\[\text{Total votes}=90+120+150\]
So, we get the central angle of each season as,
\[\text{Central angle of each season}=\dfrac{\text{No}\text{.of votes of particular season}}{\text{Total votes}}\times {{360}^{\circ }}\]
So, we get,
\[\text{Central angle of winter}=\dfrac{\text{No}\text{.of votes for winter}}{\text{Total votes}}\times {{360}^{\circ }}\]
By substituting the total votes as 360 and votes for winter as 150, we get,
\[\Rightarrow \text{Central angle of winter}=\dfrac{150}{360}\times {{360}^{\circ }}\]
\[\Rightarrow \text{Central angle of winter}={{150}^{\circ }}\]
Similarly, we get the central angle of the rainy season as
\[\Rightarrow \text{Central angle of rainy season}=\dfrac{120}{360}\times {{360}^{\circ }}\]
\[\Rightarrow \text{Central angle of rainy season}={{120}^{\circ }}\]
Similarly, we get the central angle of the summer season as
\[\Rightarrow \text{Central angle of summer season}=\dfrac{90}{360}\times {{360}^{\circ }}\]
\[\Rightarrow \text{Central angle of summer season}={{90}^{\circ }}\]
So, now by using the central angles, we can draw the pie chart as follows.
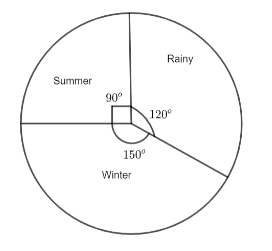
Hence, option (c) is the right answer
Note: In this question, students can verify by adding all the angles and checking if it is equal to \[{{360}^{\circ }}\] or not. Also, in the above question as we can see that the angles are equal to the number of votes only because here the total number of votes was \[{{360}^{\circ }}\] but this won’t be true in all the cases and the number of votes and angles could be different as well for any other case when total would be different.
Complete step-by-step answer:
In this question, by using the following table, we have to find the central angle of winter.
| Season | Number of Votes |
| Summer | 90 |
| Rainy | 120 |
| Winter | 150 |
We know that the pie chart is basically a type of graph in which a circle is divided into sectors that each represent a proportion of the whole.
Let us find the total number of votes. So, we get,
Total votes = (Number of votes of Summer season + (Number of votes of Rainy Season) + (Number of votes of Winter Season)
By substituting the values from the table, we get,
\[\text{Total votes}=90+120+150\]
So, we get the central angle of each season as,
\[\text{Central angle of each season}=\dfrac{\text{No}\text{.of votes of particular season}}{\text{Total votes}}\times {{360}^{\circ }}\]
So, we get,
\[\text{Central angle of winter}=\dfrac{\text{No}\text{.of votes for winter}}{\text{Total votes}}\times {{360}^{\circ }}\]
By substituting the total votes as 360 and votes for winter as 150, we get,
\[\Rightarrow \text{Central angle of winter}=\dfrac{150}{360}\times {{360}^{\circ }}\]
\[\Rightarrow \text{Central angle of winter}={{150}^{\circ }}\]
Similarly, we get the central angle of the rainy season as
\[\Rightarrow \text{Central angle of rainy season}=\dfrac{120}{360}\times {{360}^{\circ }}\]
\[\Rightarrow \text{Central angle of rainy season}={{120}^{\circ }}\]
Similarly, we get the central angle of the summer season as
\[\Rightarrow \text{Central angle of summer season}=\dfrac{90}{360}\times {{360}^{\circ }}\]
\[\Rightarrow \text{Central angle of summer season}={{90}^{\circ }}\]
So, now by using the central angles, we can draw the pie chart as follows.
Hence, option (c) is the right answer
Note: In this question, students can verify by adding all the angles and checking if it is equal to \[{{360}^{\circ }}\] or not. Also, in the above question as we can see that the angles are equal to the number of votes only because here the total number of votes was \[{{360}^{\circ }}\] but this won’t be true in all the cases and the number of votes and angles could be different as well for any other case when total would be different.
Recently Updated Pages
Master Class 9 General Knowledge: Engaging Questions & Answers for Success
Master Class 9 Social Science: Engaging Questions & Answers for Success
Master Class 9 English: Engaging Questions & Answers for Success
Master Class 9 Maths: Engaging Questions & Answers for Success
Master Class 9 Science: Engaging Questions & Answers for Success
Class 9 Question and Answer - Your Ultimate Solutions Guide
Trending doubts
Difference Between Plant Cell and Animal Cell
Fill the blanks with the suitable prepositions 1 The class 9 english CBSE
Who is eligible for RTE class 9 social science CBSE
Which places in India experience sunrise first and class 9 social science CBSE
What is pollution? How many types of pollution? Define it
Name 10 Living and Non living things class 9 biology CBSE