


How do you graph $y = - 3x$ by plotting points $?$
Answer
492.9k+ views
Hint: In the given question, the equation of a straight line in two variables has been given to us and we have to plot the graph of this line by finding out different points. We know that the standard slope-intercept form of equation for a straight line is: $y = mx + c$ ; where m is called the slope or gradient of the line and it gives information about the direction and steepness of the straight line and c is called the y intercept means the value of $y$ when $x = 0$ . To solve this question, we will find out different points by the slope given to us in the question and then we will plot those points and join them to get the graph for the equation $y = - 3x$ .
Complete step by step answer:
The general form of equation of a straight line in slope intercept form is written as:
$ \Rightarrow y = mx + c{\text{ }}......\left( 1 \right)$
The given equation is ;
$ \Rightarrow y = - 3x$
The above equation can also be written as;
$ \Rightarrow y = - 3x + 0{\text{ }}......\left( 2 \right)$
Comparing equation $1$ and equation $2$ , we get ;
Slope $ \Rightarrow m = - 3$
And y-intercept $ \Rightarrow c = 0$
Recall that y-intercept or c is the value of $y{\text{ when }}x = 0$ , hence we get a starting point $\left( {0,0} \right)$ .
By the definition of slope, we know that ;
${\text{Slope}} \Rightarrow m = \dfrac{{{\text{change in }}y}}{{{\text{change in }}x}} = \dfrac{{\Delta y}}{{\Delta x}}$
In the given question ;
Slope $ \Rightarrow m = \dfrac{{ - 3}}{{ + 1}} = \dfrac{{\Delta y}}{{\Delta x}} = \dfrac{{{\text{rise}}}}{{{\text{run}}}}{\text{ }}......\left( 3 \right)$
We already know the y-intercept or starting point is $\left( {0,0} \right)$ and we also know the slope of the straight line from equation $3$ , hence we can find out our next point using the given slope.
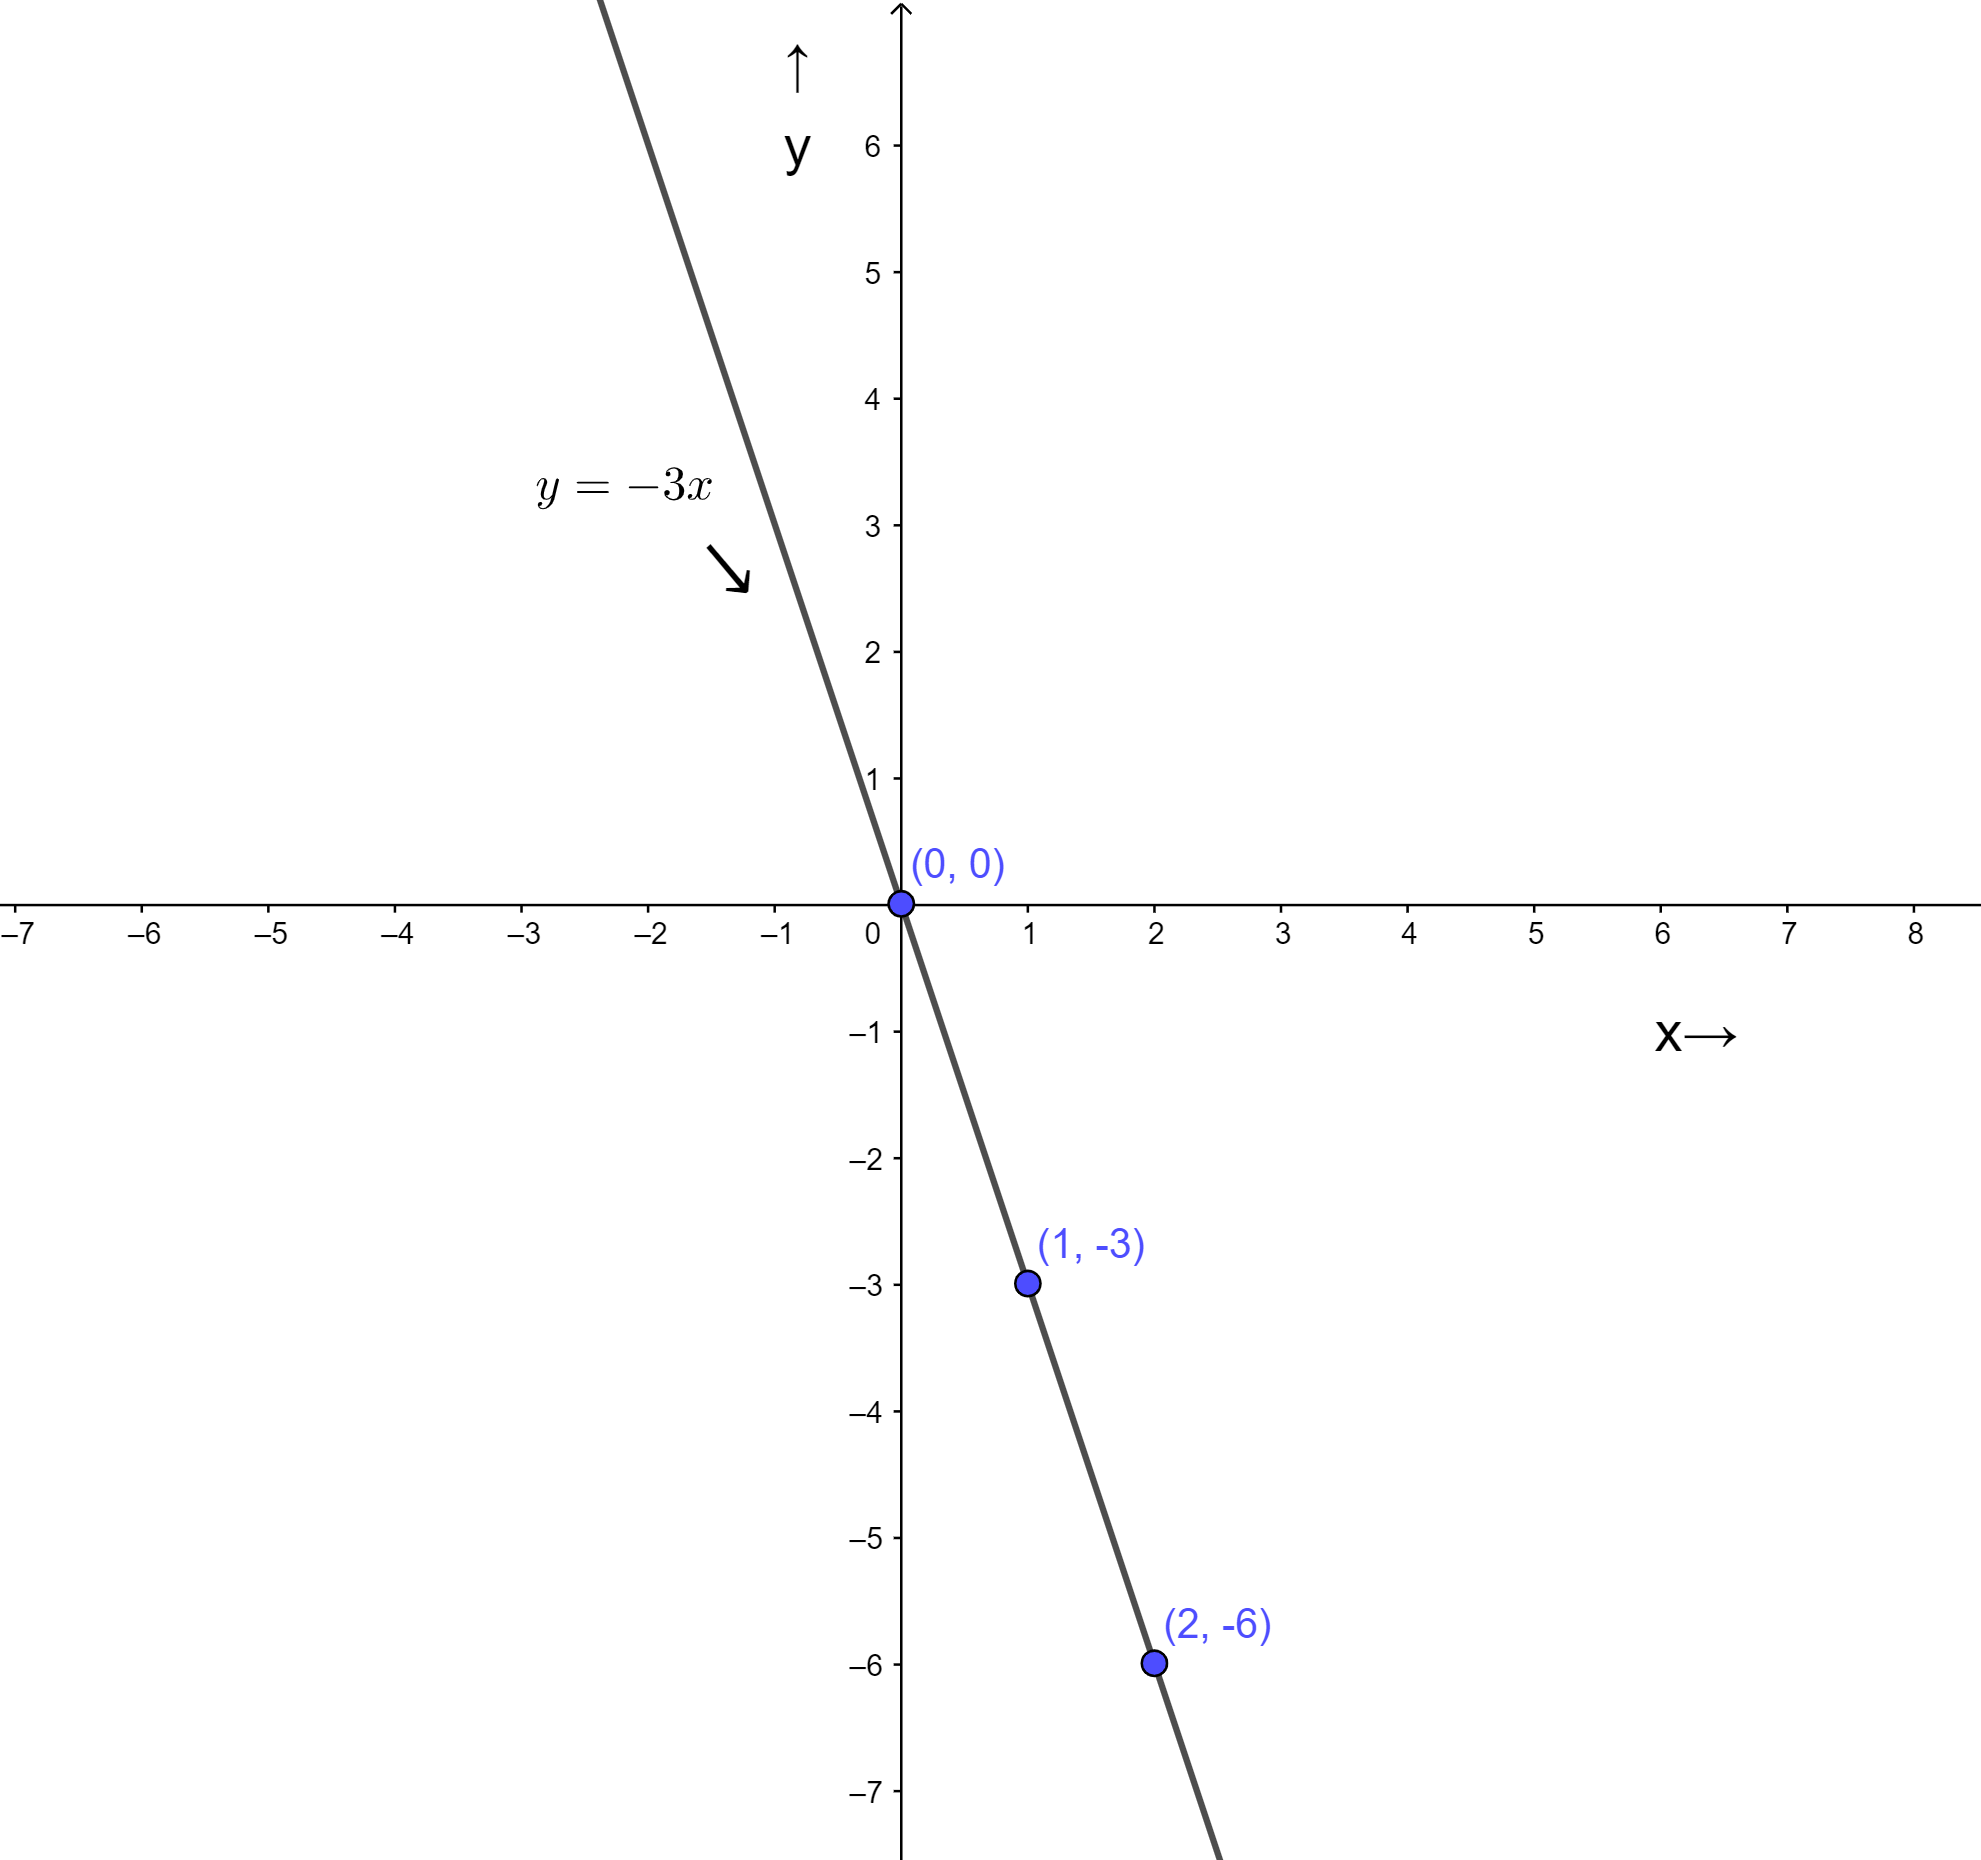
From equation $3$ , we can see that we have to rise $ - 3$ from $\left( {0,0} \right)$ in the negative y direction and from there we have to move horizontally in the positive x direction by $1$ , this gives the next point as $\left( {1, - 3} \right)$ .
Again from point $\left( {1, - 3} \right)$ , go vertically $ - 3$ in the negative y direction and from there go $ + 1$ in the positive x direction, this gives us the next point as $\left( {2, - 6} \right)$ .
So, now we have three points to plot the graph of the given straight line i.e. $\left( {0,0} \right),{\text{ }}\left( {1, - 3} \right){\text{ and }}\left( {2, - 6} \right)$. The graph for the equation $y = - 3x$ is drawn below:
Note:
In this question, we have found out different points by the slope given in the question. We can also find different points by substituting a value of x in the given equation $y = - 3x$ and then determine the resulting values of y. Every pair of x and y values represents an ordered pair that can be plotted on the graph. After joining all the points we must get a straight line, if that is not the case then there is a calculation mistake. This is another method of plotting the graph when a linear equation in two variables is given in the question.
Complete step by step answer:
The general form of equation of a straight line in slope intercept form is written as:
$ \Rightarrow y = mx + c{\text{ }}......\left( 1 \right)$
The given equation is ;
$ \Rightarrow y = - 3x$
The above equation can also be written as;
$ \Rightarrow y = - 3x + 0{\text{ }}......\left( 2 \right)$
Comparing equation $1$ and equation $2$ , we get ;
Slope $ \Rightarrow m = - 3$
And y-intercept $ \Rightarrow c = 0$
Recall that y-intercept or c is the value of $y{\text{ when }}x = 0$ , hence we get a starting point $\left( {0,0} \right)$ .
By the definition of slope, we know that ;
${\text{Slope}} \Rightarrow m = \dfrac{{{\text{change in }}y}}{{{\text{change in }}x}} = \dfrac{{\Delta y}}{{\Delta x}}$
In the given question ;
Slope $ \Rightarrow m = \dfrac{{ - 3}}{{ + 1}} = \dfrac{{\Delta y}}{{\Delta x}} = \dfrac{{{\text{rise}}}}{{{\text{run}}}}{\text{ }}......\left( 3 \right)$
We already know the y-intercept or starting point is $\left( {0,0} \right)$ and we also know the slope of the straight line from equation $3$ , hence we can find out our next point using the given slope.
From equation $3$ , we can see that we have to rise $ - 3$ from $\left( {0,0} \right)$ in the negative y direction and from there we have to move horizontally in the positive x direction by $1$ , this gives the next point as $\left( {1, - 3} \right)$ .
Again from point $\left( {1, - 3} \right)$ , go vertically $ - 3$ in the negative y direction and from there go $ + 1$ in the positive x direction, this gives us the next point as $\left( {2, - 6} \right)$ .
So, now we have three points to plot the graph of the given straight line i.e. $\left( {0,0} \right),{\text{ }}\left( {1, - 3} \right){\text{ and }}\left( {2, - 6} \right)$. The graph for the equation $y = - 3x$ is drawn below:
Note:
In this question, we have found out different points by the slope given in the question. We can also find different points by substituting a value of x in the given equation $y = - 3x$ and then determine the resulting values of y. Every pair of x and y values represents an ordered pair that can be plotted on the graph. After joining all the points we must get a straight line, if that is not the case then there is a calculation mistake. This is another method of plotting the graph when a linear equation in two variables is given in the question.

Recently Updated Pages
Master Class 8 Social Science: Engaging Questions & Answers for Success
Master Class 8 English: Engaging Questions & Answers for Success
Class 8 Question and Answer - Your Ultimate Solutions Guide
Master Class 8 Maths: Engaging Questions & Answers for Success
Master Class 8 Science: Engaging Questions & Answers for Success
Master Class 7 English: Engaging Questions & Answers for Success
Trending doubts
Difference Between Plant Cell and Animal Cell
Fill the blanks with the suitable prepositions 1 The class 9 english CBSE
Who is eligible for RTE class 9 social science CBSE
Which places in India experience sunrise first and class 9 social science CBSE
What is pollution? How many types of pollution? Define it
Name 10 Living and Non living things class 9 biology CBSE