


How do you graph \[5 - 2i\]?
Answer
544.2k+ views
Hint: Here in this question, we have to plot the graph for the given points. Here we have a complex number. They have given only one value of x and y. Hence by considering the points we plot the graph for the given question. hence the solution or graph is obtained for the given question.
Complete step by step solution:
Here in this question, we have to plot the graph for the given function. A graph of a function is a set of ordered pairs and it is represented as \[y = f(x)\], where x and f(x) are real numbers. These pairs are in the form of cartesian form and the graph is the two-dimensional graph.
Here the given number is in the form of a complex number. the general form of complex numbers is defined as \[x + iy\]. When we compare the general and given complex numbers. the value of x is 5 and the value of y is -2.
Usually the point is generally represented as \[(x,y)\]. The first term represents the x value and the second term represents the y value. Here we have to plot the graph for the points \[\left( {5, - 2} \right)\]. Here when the x value is 5, then the value of y is -2. From the origin of a graph we have to move 7 steps right side along x-axis or real axis and 2 step downwards along y-axis or imaginary axis from when x point locate \[\left( {5, - 2} \right)\].
Therefore the graph for the points is plotted as shown below:
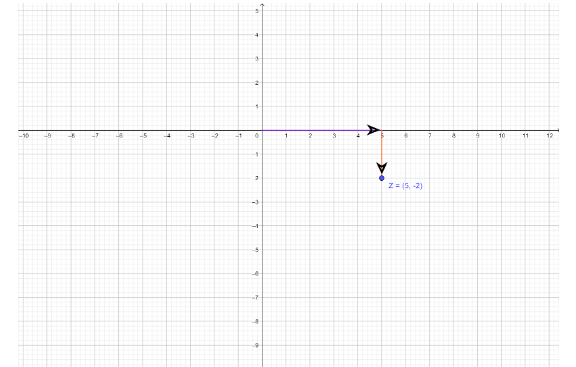
The line represents the movement.
Note: The graph is plotted x-axis versus y axis. The graph is two dimensional. By the equation of a graph, we can plot the graph by assuming the value of x. We can’t assume the value of y. Here we plot the graph for the complex number, the complex number is given in general as \[x + iy\], where x value and y value is known and we plot the point.
Complete step by step solution:
Here in this question, we have to plot the graph for the given function. A graph of a function is a set of ordered pairs and it is represented as \[y = f(x)\], where x and f(x) are real numbers. These pairs are in the form of cartesian form and the graph is the two-dimensional graph.
Here the given number is in the form of a complex number. the general form of complex numbers is defined as \[x + iy\]. When we compare the general and given complex numbers. the value of x is 5 and the value of y is -2.
Usually the point is generally represented as \[(x,y)\]. The first term represents the x value and the second term represents the y value. Here we have to plot the graph for the points \[\left( {5, - 2} \right)\]. Here when the x value is 5, then the value of y is -2. From the origin of a graph we have to move 7 steps right side along x-axis or real axis and 2 step downwards along y-axis or imaginary axis from when x point locate \[\left( {5, - 2} \right)\].
Therefore the graph for the points is plotted as shown below:
The line represents the movement.
Note: The graph is plotted x-axis versus y axis. The graph is two dimensional. By the equation of a graph, we can plot the graph by assuming the value of x. We can’t assume the value of y. Here we plot the graph for the complex number, the complex number is given in general as \[x + iy\], where x value and y value is known and we plot the point.
Recently Updated Pages
Master Class 11 Computer Science: Engaging Questions & Answers for Success
Master Class 11 Business Studies: Engaging Questions & Answers for Success
Master Class 11 Economics: Engaging Questions & Answers for Success
Master Class 11 English: Engaging Questions & Answers for Success
Master Class 11 Maths: Engaging Questions & Answers for Success
Master Class 11 Biology: Engaging Questions & Answers for Success
Trending doubts
One Metric ton is equal to kg A 10000 B 1000 C 100 class 11 physics CBSE
There are 720 permutations of the digits 1 2 3 4 5 class 11 maths CBSE
Discuss the various forms of bacteria class 11 biology CBSE
Draw a diagram of a plant cell and label at least eight class 11 biology CBSE
State the laws of reflection of light
Explain zero factorial class 11 maths CBSE