


How do you graph the function \[f(x) = - 4x\] ?
Answer
546k+ views
Hint:We need to draw the graph ‘x’ versus ‘y’. We give the random values for ‘x’ and we find the value of ‘f(x)’. We can give all real numbers for the value of ‘x’. Thus we will have coordinate points (x, y) (here ‘y’ is f(x)). Hence, we can plot the graph by using the values. We can also draw the graph using the intercept method.
Complete step by step answer:
Given \[f(x) = - 4x\]. Let's give the values for ‘x’ and we find the value of ‘f(x)’.
Put \[x = 1\] in \[f(x) = - 4x\] we have,
\[f(1) = - 4 \times (1) = - 4\]
Thus we have coordinate points \[(1, - 4)\].
Put \[x = - 1\]in \[f(x) = - 4x\] we have,
\[f( - 1) = - 4 \times ( - 1) = 4\]
Thus we have coordinate points \[( - 1,4)\].
Put \[x = 2\] in \[f(x) = - 4x\] we have,
\[f(2) = - 4 \times (2) = - 8\]
Thus we have coordinate points \[(2, - 8)\].
Put \[x = - 2\]in \[f(x) = - 4x\] we have,
\[f( - 2) = - 4 \times ( - 2) = 8\]
Thus we have coordinate points \[( - 2,8)\].
Put \[x = 3\] in \[f(x) = - 4x\] we have,
\[f(3) = - 4 \times (3) = - 12\]
Thus we have a coordinate point after rounding off is \[(3, - 12)\].
Put \[x = - 3\]in \[f(x) = - 4x\] we have,
\[f( - 3) = - 4 \times ( - 3) = 12\]
Thus we have coordinate point after rounding off is \[( - 3,12)\].Thus we have,
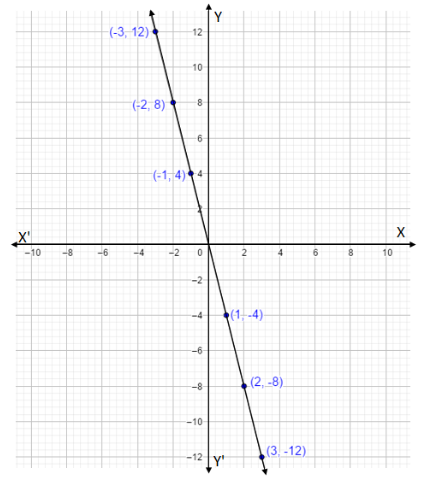
Let’s draw the graph for these coordinates,
Note:A graph shows the relation between two variable quantities, it contains two axes perpendicular to each other namely the x-axis and the y-axis. Each variable is measured along one of the axes. In the question, we are given one linear equation containing two variables namely x and y, x is measured along the x-axis and y is measured along the y-axis while tracing the given equations.
Complete step by step answer:
Given \[f(x) = - 4x\]. Let's give the values for ‘x’ and we find the value of ‘f(x)’.
Put \[x = 1\] in \[f(x) = - 4x\] we have,
\[f(1) = - 4 \times (1) = - 4\]
Thus we have coordinate points \[(1, - 4)\].
Put \[x = - 1\]in \[f(x) = - 4x\] we have,
\[f( - 1) = - 4 \times ( - 1) = 4\]
Thus we have coordinate points \[( - 1,4)\].
Put \[x = 2\] in \[f(x) = - 4x\] we have,
\[f(2) = - 4 \times (2) = - 8\]
Thus we have coordinate points \[(2, - 8)\].
Put \[x = - 2\]in \[f(x) = - 4x\] we have,
\[f( - 2) = - 4 \times ( - 2) = 8\]
Thus we have coordinate points \[( - 2,8)\].
Put \[x = 3\] in \[f(x) = - 4x\] we have,
\[f(3) = - 4 \times (3) = - 12\]
Thus we have a coordinate point after rounding off is \[(3, - 12)\].
Put \[x = - 3\]in \[f(x) = - 4x\] we have,
\[f( - 3) = - 4 \times ( - 3) = 12\]
Thus we have coordinate point after rounding off is \[( - 3,12)\].Thus we have,
| \[x\] | \[1\] | \[ - 1\] | \[2\] | \[ - 2\] | \[3\] | \[ - 3\] |
| \[y = f(x)\] | \[ - 4\] | \[4\] | \[ - 8\] | \[8\] | \[ - 12\] | \[12\] |
Let’s draw the graph for these coordinates,
Note:A graph shows the relation between two variable quantities, it contains two axes perpendicular to each other namely the x-axis and the y-axis. Each variable is measured along one of the axes. In the question, we are given one linear equation containing two variables namely x and y, x is measured along the x-axis and y is measured along the y-axis while tracing the given equations.
Recently Updated Pages
Master Class 9 General Knowledge: Engaging Questions & Answers for Success
Master Class 9 Social Science: Engaging Questions & Answers for Success
Master Class 9 English: Engaging Questions & Answers for Success
Master Class 9 Maths: Engaging Questions & Answers for Success
Master Class 9 Science: Engaging Questions & Answers for Success
Class 9 Question and Answer - Your Ultimate Solutions Guide
Trending doubts
Difference Between Plant Cell and Animal Cell
Fill the blanks with the suitable prepositions 1 The class 9 english CBSE
Who is eligible for RTE class 9 social science CBSE
Which places in India experience sunrise first and class 9 social science CBSE
What is pollution? How many types of pollution? Define it
Name 10 Living and Non living things class 9 biology CBSE