


How do you graph the line $y = 2x - 5$?
Answer
558k+ views
Hint: As here it is given the equation of the line, so we just need two points to form a line. So we can find the points where the line will meet the $x{\text{ and }}y$ axis and then join the two points together to form the equation of the line on the graph.
Complete step by step solution:
Here we are given to graph the equation which is given as $y = 2x - 5$
So we must know that whenever we are given the equation of the form $y = mx + c$ it is the equation of the line. To plot the graph of the line, the only thing we need is the two points that are contained on the line. Now we can join those two points and get the required graph of the line.
So here we have the line $y = 2x - 5$
So we can find the point where the line meets the $x - $axis by putting in the line equation as $y = 0$ because on the $x - $axis the $y = 0$
So putting $y = 0$ we get:
$y = 2x - 5$
$
0 = 2x - 5 \\
\Rightarrow x = \dfrac{5}{2} \\
$
So we have got one point which is on the x axis as $\left( {\dfrac{5}{2},0} \right)$ and now we can find the other point that will be on the $y - {\text{axis}}$
For this we need to put in the equation of the line $x = 0$ we will get:
$
y = 2x - 5 \\
\Rightarrow y = 0 - 5 \\
\Rightarrow y = - 5 \\
$
Hence we can say that other point is $\left( {0, - 5} \right)$
Hence we can plot the two points on the graph which are $\left( {\dfrac{5}{2},0} \right)$ and $\left( {0, - 5} \right)$ and join them to get the graph of the line $y = 2x - 5$
We will get it as:
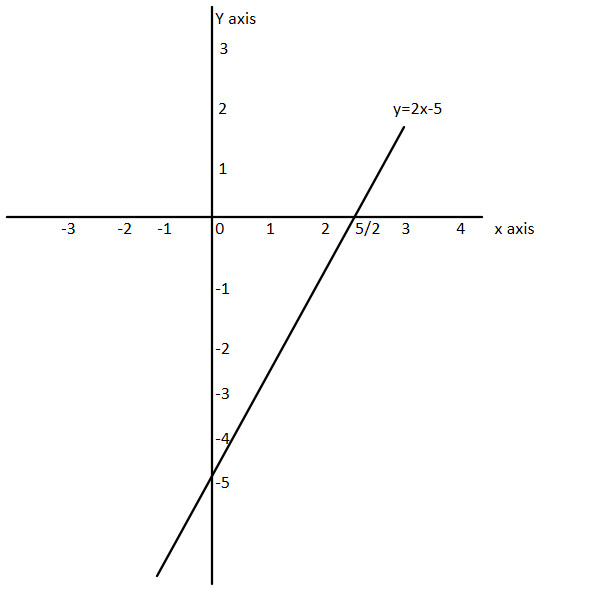
Hence we have got the graph for the equation $y = 2x - 5$
Note: Whenever the student is asked to plot the graph of any equation of the line, he must simply put $x = 0{\text{ and }}y = 0$ and get the intercepts made by the line on both the axis and then join both the points on the axes and get the equation of the line.
Complete step by step solution:
Here we are given to graph the equation which is given as $y = 2x - 5$
So we must know that whenever we are given the equation of the form $y = mx + c$ it is the equation of the line. To plot the graph of the line, the only thing we need is the two points that are contained on the line. Now we can join those two points and get the required graph of the line.
So here we have the line $y = 2x - 5$
So we can find the point where the line meets the $x - $axis by putting in the line equation as $y = 0$ because on the $x - $axis the $y = 0$
So putting $y = 0$ we get:
$y = 2x - 5$
$
0 = 2x - 5 \\
\Rightarrow x = \dfrac{5}{2} \\
$
So we have got one point which is on the x axis as $\left( {\dfrac{5}{2},0} \right)$ and now we can find the other point that will be on the $y - {\text{axis}}$
For this we need to put in the equation of the line $x = 0$ we will get:
$
y = 2x - 5 \\
\Rightarrow y = 0 - 5 \\
\Rightarrow y = - 5 \\
$
Hence we can say that other point is $\left( {0, - 5} \right)$
Hence we can plot the two points on the graph which are $\left( {\dfrac{5}{2},0} \right)$ and $\left( {0, - 5} \right)$ and join them to get the graph of the line $y = 2x - 5$
We will get it as:
Hence we have got the graph for the equation $y = 2x - 5$
Note: Whenever the student is asked to plot the graph of any equation of the line, he must simply put $x = 0{\text{ and }}y = 0$ and get the intercepts made by the line on both the axis and then join both the points on the axes and get the equation of the line.

Recently Updated Pages
Master Class 9 General Knowledge: Engaging Questions & Answers for Success
Master Class 9 Social Science: Engaging Questions & Answers for Success
Master Class 9 English: Engaging Questions & Answers for Success
Master Class 9 Maths: Engaging Questions & Answers for Success
Master Class 9 Science: Engaging Questions & Answers for Success
Class 9 Question and Answer - Your Ultimate Solutions Guide
Trending doubts
Difference Between Plant Cell and Animal Cell
Fill the blanks with the suitable prepositions 1 The class 9 english CBSE
Who is eligible for RTE class 9 social science CBSE
Which places in India experience sunrise first and class 9 social science CBSE
What is pollution? How many types of pollution? Define it
Name 10 Living and Non living things class 9 biology CBSE