


How do you graph \[y = 4x - 5?\]
Answer
478.5k+ views
Hint: Given a problem to first identify the kind of given equation. Then find out the points of the given equation. So apply a few \[x\] values to find a few \[y\] values on the given equation. Now we have points of the equation. In these points, we arrange them correctly. Now labeled those points in the graph. Finally, we get the graph of the straight line.
Complete step-by-step answer:
Given equation is a linear equation and this equation is the straight-line format. Its means this is a straight line equation. The standard form linear equation is \[ax + by = c\] here, \[a,b\] and \[c\] are some constant values. And if a linear equation is in \[y = mx + c\] format, then the equation has a slope and intercept value. so the given equation has a slope and intercept.
The linear equation is \[y = 4x - 5\]
Any line equation can be graphed using some points, select few \[x\] values and plug them into the equation. then we find the corresponding \[y\] values. So we assume \[x\] values to find \[y\] values.
Assume that,
\[x = - 4\] apply the \[x\] value in equation \[y\] ,
$y = 4( - 4) - 5$
$ = - 16 - 5 $
$ = - 21$
\[x = - 3\] apply the \[x\] value in equation \[y\] ,
$ y = 4( - 3) - 5 $
$ = - 12 - 5 $
$ = - 17 $
\[x = - 2\] apply the \[x\] value in equation \[y\] ,
$ y = 4( - 2) - 5$
$ = - 8 - 5 $
$ = - 13 $
\[x = - 1\] apply the $x$value in equation \[y\] ,
$ y = 4( - 1) - 5 $
$ = - 4 - 5 $
$ = - 9 $
\[x = 0\] apply the \[x\] value in equation \[y\] ,
$ y = 4(0) - 5 $
$ = 0 - 5 $
$ = - 5 $
\[x = 1\] apply the \[x\] value in equation \[y\] ,
$ y = 4(1) - 5 $
$ = 4 - 5 $
$ = - 1 $
\[x = 2\] apply the \[x\] value in equation \[y\] ,
$ y = 4(2) - 5 $
$ = 8 - 5 $
$ = 3 $
\[x = 3\] apply the \[x\] value in equation \[y\] ,
$ y = 4(3) - 5 $
$ = 12 - 5 $
$ = 7 $
\[x = 4\] apply the \[x\] value in equation \[y\] ,
$ y = 4(4) - 5 $
$ = 16 - 5 $
$ = 11 $
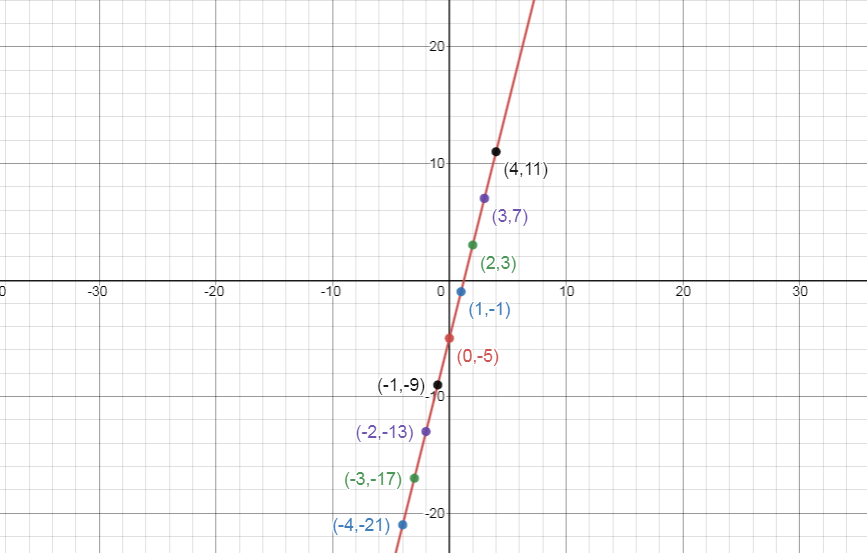
Points are, \[( - 4, - 21),( - 3, - 17),( - 2, - 13),( - 1, - 9),(0, - 5),(1, - 1),(2,3),(3,7),(4,11)\]
Label the points in the graph and draw a straight line.
Then we get a graph of \[y = 4x - 5\]
The graph is
Note: In linear equation is given the straight-line graph. Find points of the equation in some particular interval. So given the problem, find the values in between \[t\] \[x \in \left[ { - 4,4} \right]\] this interval. Now find the values in a small region. Find the points in the label to the graph. Now we get the straight-line graph on the given equation. And carefully, labeled the find out points in the graph.
Complete step-by-step answer:
Given equation is a linear equation and this equation is the straight-line format. Its means this is a straight line equation. The standard form linear equation is \[ax + by = c\] here, \[a,b\] and \[c\] are some constant values. And if a linear equation is in \[y = mx + c\] format, then the equation has a slope and intercept value. so the given equation has a slope and intercept.
The linear equation is \[y = 4x - 5\]
Any line equation can be graphed using some points, select few \[x\] values and plug them into the equation. then we find the corresponding \[y\] values. So we assume \[x\] values to find \[y\] values.
Assume that,
\[x = - 4\] apply the \[x\] value in equation \[y\] ,
$y = 4( - 4) - 5$
$ = - 16 - 5 $
$ = - 21$
\[x = - 3\] apply the \[x\] value in equation \[y\] ,
$ y = 4( - 3) - 5 $
$ = - 12 - 5 $
$ = - 17 $
\[x = - 2\] apply the \[x\] value in equation \[y\] ,
$ y = 4( - 2) - 5$
$ = - 8 - 5 $
$ = - 13 $
\[x = - 1\] apply the $x$value in equation \[y\] ,
$ y = 4( - 1) - 5 $
$ = - 4 - 5 $
$ = - 9 $
\[x = 0\] apply the \[x\] value in equation \[y\] ,
$ y = 4(0) - 5 $
$ = 0 - 5 $
$ = - 5 $
\[x = 1\] apply the \[x\] value in equation \[y\] ,
$ y = 4(1) - 5 $
$ = 4 - 5 $
$ = - 1 $
\[x = 2\] apply the \[x\] value in equation \[y\] ,
$ y = 4(2) - 5 $
$ = 8 - 5 $
$ = 3 $
\[x = 3\] apply the \[x\] value in equation \[y\] ,
$ y = 4(3) - 5 $
$ = 12 - 5 $
$ = 7 $
\[x = 4\] apply the \[x\] value in equation \[y\] ,
$ y = 4(4) - 5 $
$ = 16 - 5 $
$ = 11 $
Points are, \[( - 4, - 21),( - 3, - 17),( - 2, - 13),( - 1, - 9),(0, - 5),(1, - 1),(2,3),(3,7),(4,11)\]
Label the points in the graph and draw a straight line.
Then we get a graph of \[y = 4x - 5\]
The graph is
Note: In linear equation is given the straight-line graph. Find points of the equation in some particular interval. So given the problem, find the values in between \[t\] \[x \in \left[ { - 4,4} \right]\] this interval. Now find the values in a small region. Find the points in the label to the graph. Now we get the straight-line graph on the given equation. And carefully, labeled the find out points in the graph.
Recently Updated Pages
Master Class 10 Computer Science: Engaging Questions & Answers for Success
Master Class 10 General Knowledge: Engaging Questions & Answers for Success
Master Class 10 English: Engaging Questions & Answers for Success
Master Class 10 Social Science: Engaging Questions & Answers for Success
Master Class 10 Maths: Engaging Questions & Answers for Success
Master Class 10 Science: Engaging Questions & Answers for Success
Trending doubts
What is the median of the first 10 natural numbers class 10 maths CBSE
The draft of the Preamble of the Indian Constitution class 10 social science CBSE
Which women's tennis player has 24 Grand Slam singles titles?
Who gave "Inqilab Zindabad" slogan?
Why is there a time difference of about 5 hours between class 10 social science CBSE
Who is the Brand Ambassador of Incredible India?