


How do you graph $ y = - \sqrt {4 - {x^2}} $ ?
Answer
544.2k+ views
Hint: A graph of a function f is the set of ordered pairs; the equation of graph is generally represented as $ y = f\left( x \right) $ , where x and f(x) are real numbers. We substitute the value of x and we determine the value of y and then we mark the points in the graph and we join the points.
Complete step by step solution:
Here in this question, we have to plot the graph for the given function. A graph of a function is set of ordered pairs and it is represented as $ y = f\left( x \right) $ , where x and f(x) are real numbers. These pairs are in the form of cartesian form and the graph is the two-dimensional graph.
First, we have to find the value of y by using the graph equation $ y = - \sqrt {4 - {x^2}} $ . Let we substitute the value of x as $ 0 $ , $ 2 $ , and $ - 2 $ .
Now we consider the value of x as $ 0 $ , the value of y is
$ \Rightarrow y = - \sqrt {4 - {0^2}} $
$ \Rightarrow y = - \sqrt 4 = - 2 $
Now we consider the value of x as $ 2 $ , the value of y is
$ \Rightarrow y = - \sqrt {4 - {2^2}} $
$ \Rightarrow y = 0 $
Now we consider the value of x as $ - 2 $ , the value of y is
$ \Rightarrow y = - \sqrt {4 - {{\left( { - 2} \right)}^2}} $
$ \Rightarrow y = 0 $
Now we draw a table for these values we have
The graph plotted for these point is represented below:
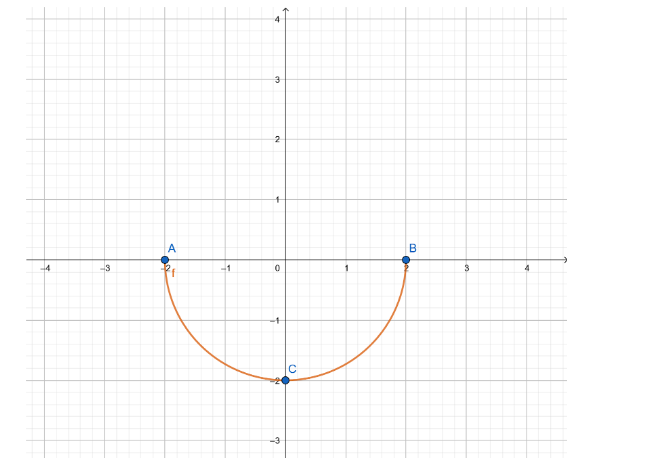
Note: The graph plotted is of two dimensional. The graph is plotted in x-axis versus y axis. By the equation of a graph, we can plot the graph by assuming the value of x. We can’t assume the value of y because the value of y depends on the value of x.
Complete step by step solution:
Here in this question, we have to plot the graph for the given function. A graph of a function is set of ordered pairs and it is represented as $ y = f\left( x \right) $ , where x and f(x) are real numbers. These pairs are in the form of cartesian form and the graph is the two-dimensional graph.
First, we have to find the value of y by using the graph equation $ y = - \sqrt {4 - {x^2}} $ . Let we substitute the value of x as $ 0 $ , $ 2 $ , and $ - 2 $ .
Now we consider the value of x as $ 0 $ , the value of y is
$ \Rightarrow y = - \sqrt {4 - {0^2}} $
$ \Rightarrow y = - \sqrt 4 = - 2 $
Now we consider the value of x as $ 2 $ , the value of y is
$ \Rightarrow y = - \sqrt {4 - {2^2}} $
$ \Rightarrow y = 0 $
Now we consider the value of x as $ - 2 $ , the value of y is
$ \Rightarrow y = - \sqrt {4 - {{\left( { - 2} \right)}^2}} $
$ \Rightarrow y = 0 $
Now we draw a table for these values we have
| x | $ 0 $ | $ - 2 $ | $ 2 $ |
| y | $ - 2 $ | $ 0 $ | $ 0 $ |
The graph plotted for these point is represented below:
Note: The graph plotted is of two dimensional. The graph is plotted in x-axis versus y axis. By the equation of a graph, we can plot the graph by assuming the value of x. We can’t assume the value of y because the value of y depends on the value of x.

Recently Updated Pages
Master Class 9 General Knowledge: Engaging Questions & Answers for Success
Master Class 9 Social Science: Engaging Questions & Answers for Success
Master Class 9 English: Engaging Questions & Answers for Success
Master Class 9 Maths: Engaging Questions & Answers for Success
Master Class 9 Science: Engaging Questions & Answers for Success
Class 9 Question and Answer - Your Ultimate Solutions Guide
Trending doubts
Difference Between Plant Cell and Animal Cell
Fill the blanks with the suitable prepositions 1 The class 9 english CBSE
Who is eligible for RTE class 9 social science CBSE
Which places in India experience sunrise first and class 9 social science CBSE
What is pollution? How many types of pollution? Define it
Name 10 Living and Non living things class 9 biology CBSE