


In an acid-base titration, $0.1M$ $HCl$ solution was added to the $NaOH$ solution of unknown strength. Which of the following correctly shows the change of pH of the titration mixture in this experiment?
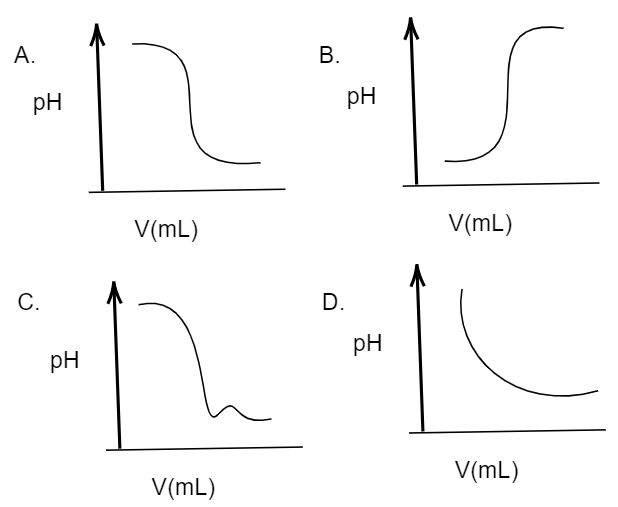
A. (A)
B. (C)
C. (D)
D. (B)
Answer
577.2k+ views
Hint: Remember the pH of an acidic solution shows lower value as compared to when a solution has a basic solution (i.e. will show higher pH value). So, first figure out what will be the pH of the first solution and whether it is acid or base and then find out what change in pH will happen when another solution (acidic or basic) is added.
Complete step by step solution:
Given that, In an acid-base titration, $0.1M$$HCl$ solution was added to the $NaOH$ solution of unknown strength. So, here the solution containing $HCl$ is acidic in nature, as we know $HCl$ (hydrochloric acid) is a type of strong acid. Whereas the solution containing $NaOH$(sodium hydroxide, which is a strong base) will be basic in nature. We know that acidic solutions usually show a value of pH ranging from $0$ to $7$ while basic solutions will show a value of pH in pH scale ranging from $7$ to $14$. Further, it is said that the acidity decreases as the value of pH increases from $0$ to $7$, whereas the basicity decreases as the value of pH decreases from $14$ to $7$. So, here at first the solution has sodium hydroxide solution which is basic in nature, thus the pH will be high in the graph. And when hydrochloric acid (an acid) is added to this solution, the pH will obviously decrease indicating the consumption of the base and forming a salt. Thus, in the graph the pH value will decrease. So, the appropriate graph for this change should be:
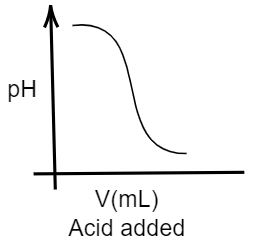
Hence, the correct option is A.
Note: You can get confused with the options given. Tally the right diagram with the correct option. The graph will have an increasing peak, when a basic solution will be added to an acidic solution indicating an increase in the pH, as acid is being consumed.
Complete step by step solution:
Given that, In an acid-base titration, $0.1M$$HCl$ solution was added to the $NaOH$ solution of unknown strength. So, here the solution containing $HCl$ is acidic in nature, as we know $HCl$ (hydrochloric acid) is a type of strong acid. Whereas the solution containing $NaOH$(sodium hydroxide, which is a strong base) will be basic in nature. We know that acidic solutions usually show a value of pH ranging from $0$ to $7$ while basic solutions will show a value of pH in pH scale ranging from $7$ to $14$. Further, it is said that the acidity decreases as the value of pH increases from $0$ to $7$, whereas the basicity decreases as the value of pH decreases from $14$ to $7$. So, here at first the solution has sodium hydroxide solution which is basic in nature, thus the pH will be high in the graph. And when hydrochloric acid (an acid) is added to this solution, the pH will obviously decrease indicating the consumption of the base and forming a salt. Thus, in the graph the pH value will decrease. So, the appropriate graph for this change should be:
Hence, the correct option is A.
Note: You can get confused with the options given. Tally the right diagram with the correct option. The graph will have an increasing peak, when a basic solution will be added to an acidic solution indicating an increase in the pH, as acid is being consumed.
Recently Updated Pages
Master Class 11 Computer Science: Engaging Questions & Answers for Success
Master Class 11 Business Studies: Engaging Questions & Answers for Success
Master Class 11 Economics: Engaging Questions & Answers for Success
Master Class 11 English: Engaging Questions & Answers for Success
Master Class 11 Maths: Engaging Questions & Answers for Success
Master Class 11 Biology: Engaging Questions & Answers for Success
Trending doubts
One Metric ton is equal to kg A 10000 B 1000 C 100 class 11 physics CBSE
There are 720 permutations of the digits 1 2 3 4 5 class 11 maths CBSE
Discuss the various forms of bacteria class 11 biology CBSE
Draw a diagram of a plant cell and label at least eight class 11 biology CBSE
State the laws of reflection of light
Explain zero factorial class 11 maths CBSE