


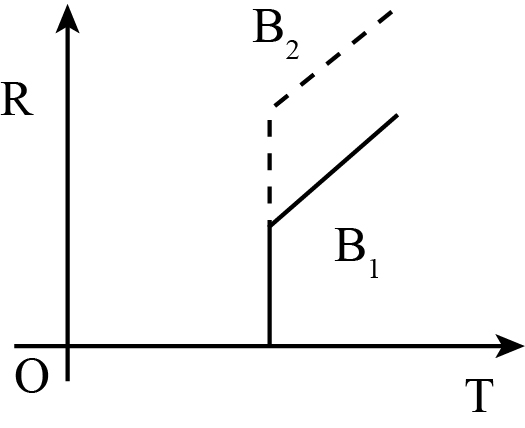
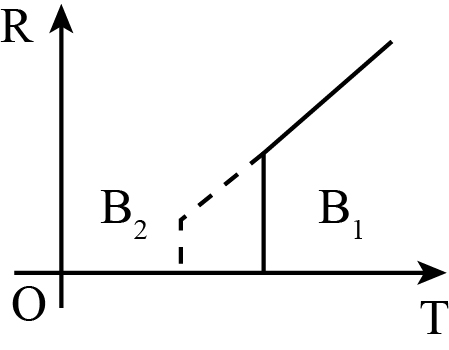
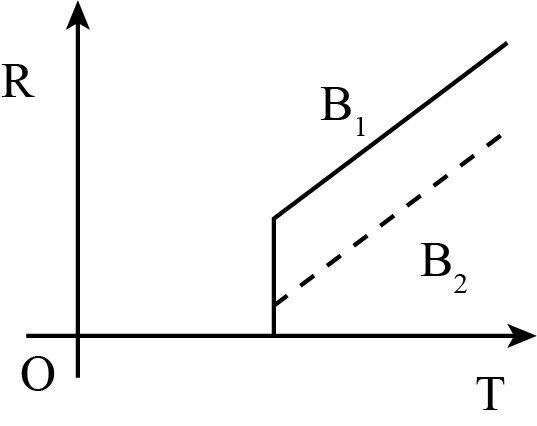
In the graphs below, the resistance R of a superconductor is shown as a function of its temperature T for two different magnetic fields \[{B_1}\] (solid line) and \[{B_2}\] (dashed line). If \[{B_2}\] is larger than \[{B_1}\] which of the following graphs shows the correct variation of R with T in these fields?
A.

B.
C.
D.
Answer
587.1k+ views
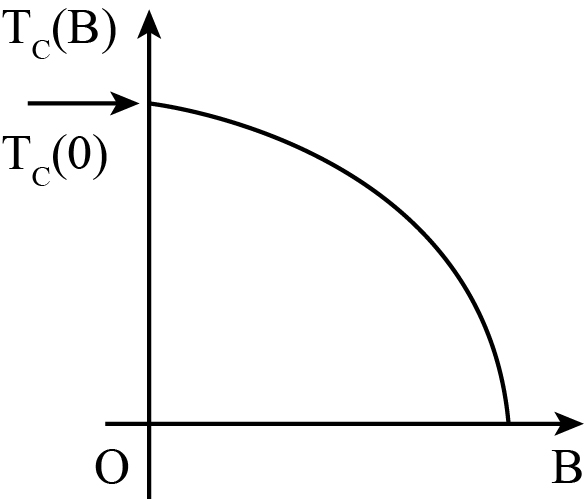
Hint: The above problem can be resolved using the concepts and the fundamentals of the magnetic field and the critical temperature. It is known that the magnitude of the magnetic field will vary inversely with the value of the critical temperature of the system. It means, at the higher critical temperature, the magnitude of the magnetic field is much lesser. On the other hand, at the lower critical temperature, the magnetic field's magnitude is much higher.
Complete step by step answer:
It is given that \[{B_2}\] is larger in magnitude as compared to \[{B_1}\]. And the magnetic field varies inversely with the critical temperature (T) as,
\[B \propto \dfrac{1}{T}\]
Therefore, the graph showing the correct variation of R with T in these fields is as plotted in (A)
So, the correct answer is “Option A”.
Note:
To resolve the given problem, one must understand the magnetic field's meaning and fundamentals and the critical temperature. The magnetic field is any region that can be considered when there is some magnitude of magnetic force being applied to that specific region or the point. And the critical temperature is the value of temperature, upon which the further vaporization of any liquid substance cannot be made possible. Therefore, there is an inverse dependency of the magnetic field's magnitude and the value of critical temperature. And there is an appropriate graph showing this variation, which is needed to be analysed and remembered.
Recently Updated Pages
Master Class 12 Economics: Engaging Questions & Answers for Success
Master Class 12 Physics: Engaging Questions & Answers for Success
Master Class 12 English: Engaging Questions & Answers for Success
Master Class 12 Social Science: Engaging Questions & Answers for Success
Master Class 12 Maths: Engaging Questions & Answers for Success
Master Class 12 Business Studies: Engaging Questions & Answers for Success
Trending doubts
Which are the Top 10 Largest Countries of the World?
What are the major means of transport Explain each class 12 social science CBSE
Draw a labelled sketch of the human eye class 12 physics CBSE
What is a transformer Explain the principle construction class 12 physics CBSE
Why cannot DNA pass through cell membranes class 12 biology CBSE
Differentiate between insitu conservation and exsitu class 12 biology CBSE