


Plot the displacement of a ball falling from rest in a viscous medium against time,
Answer
516k+ views
Hint:We know that displacement is the vector quantity which describes the position of an object with respect to some point of reference. The displacement time graph is a pictorial representation of the physical quantities, here displacement and time. We can draw the required graph as discussed below:
Complete step-by-step solution:
We know that viscosity of a given fluid is the ability of the fluid to resist the motion of any object which might be forced into it. For example, honey which is sticky and has restriction in motion has more viscosity as compared to water, which can flow easily.
Thus, let us assume that we are dropping a ball from rest into a long tube containing the viscous medium like that of honey. Then due to the viscosity of the honey, the ball will experience a resistive force, which is equal to the viscous force.
Now let us consider the displacement of the ball with respect to the initial position, which is the mouth of the tube. Clearly, as time increases, the displacement of the ball along the tube will also increase.
Thus we can say that the displacement of the ball through the viscous medium is directly proportional to the time taken. Then the graph between the displacement time is plotted and is as shown below:
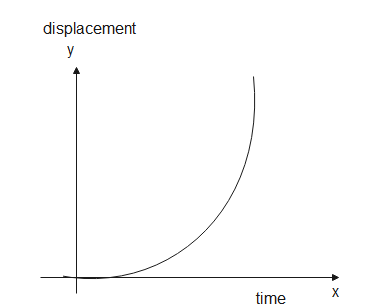
Note: Generally, the displacement time graph is plotted such that, the x-axis represents the independent quantity, which is time here and the y-axis represents the dependent quantity, which is displacement. The slope and the area under the curve is given as the velocity.
Complete step-by-step solution:
We know that viscosity of a given fluid is the ability of the fluid to resist the motion of any object which might be forced into it. For example, honey which is sticky and has restriction in motion has more viscosity as compared to water, which can flow easily.
Thus, let us assume that we are dropping a ball from rest into a long tube containing the viscous medium like that of honey. Then due to the viscosity of the honey, the ball will experience a resistive force, which is equal to the viscous force.
Now let us consider the displacement of the ball with respect to the initial position, which is the mouth of the tube. Clearly, as time increases, the displacement of the ball along the tube will also increase.
Thus we can say that the displacement of the ball through the viscous medium is directly proportional to the time taken. Then the graph between the displacement time is plotted and is as shown below:
Note: Generally, the displacement time graph is plotted such that, the x-axis represents the independent quantity, which is time here and the y-axis represents the dependent quantity, which is displacement. The slope and the area under the curve is given as the velocity.
Recently Updated Pages
Master Class 12 Economics: Engaging Questions & Answers for Success
Master Class 12 Physics: Engaging Questions & Answers for Success
Master Class 12 English: Engaging Questions & Answers for Success
Master Class 12 Social Science: Engaging Questions & Answers for Success
Master Class 12 Maths: Engaging Questions & Answers for Success
Master Class 12 Business Studies: Engaging Questions & Answers for Success
Trending doubts
Which are the Top 10 Largest Countries of the World?
What are the major means of transport Explain each class 12 social science CBSE
Draw a labelled sketch of the human eye class 12 physics CBSE
Why cannot DNA pass through cell membranes class 12 biology CBSE
Differentiate between insitu conservation and exsitu class 12 biology CBSE
Draw a neat and well labeled diagram of TS of ovary class 12 biology CBSE