


How can I represent an endothermic reaction in a potential energy diagram?
Answer
556.8k+ views
Hint: The potential energy diagram represents the change in the potential energy of the system when the reactant compound undergoes chemical reaction to form a product. In an endothermic reaction, the heat is absorbed by the system. The potential energy graph is drawn between potential energy and time.
Complete step by step answer:
The endothermic reaction is defined as the reaction where heat is absorbed. The energy changes that take place during the chemical reaction is shown by a diagram which is known as a potential energy diagram.
The potential energy diagram shows the change in the potential energy of the system when the reactant compound changes to produce.
For the endothermic reaction the enthalpy change $(\Delta H)$ is positive and for exothermic reaction the enthalpy change is negative. In the endothermic reaction, the total potential energy of the system increases as the energy is absorbed by the system. For the exothermic reaction, the total energy of the system decreases as the energy is released by the system.
The potential energy diagram for endothermic reaction is shown below.
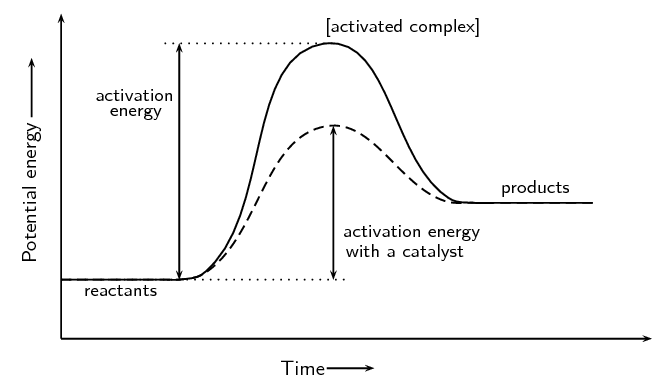
In the potential energy diagram of endothermic reaction, the potential energy of the reactant should be lower than the product. The hump is higher than the beginning which shows the system gains energy during the chemical reaction which is the activation energy complex. The reacting particles must have enough energy to overcome the barrier.
Note:
In endothermic reaction, the enthalpy change should be greater than zero $\Delta H > 0$ and for exothermic reaction the enthalpy change should be lesser than zero $\Delta H < 0$.
Complete step by step answer:
The endothermic reaction is defined as the reaction where heat is absorbed. The energy changes that take place during the chemical reaction is shown by a diagram which is known as a potential energy diagram.
The potential energy diagram shows the change in the potential energy of the system when the reactant compound changes to produce.
For the endothermic reaction the enthalpy change $(\Delta H)$ is positive and for exothermic reaction the enthalpy change is negative. In the endothermic reaction, the total potential energy of the system increases as the energy is absorbed by the system. For the exothermic reaction, the total energy of the system decreases as the energy is released by the system.
The potential energy diagram for endothermic reaction is shown below.
In the potential energy diagram of endothermic reaction, the potential energy of the reactant should be lower than the product. The hump is higher than the beginning which shows the system gains energy during the chemical reaction which is the activation energy complex. The reacting particles must have enough energy to overcome the barrier.
Note:
In endothermic reaction, the enthalpy change should be greater than zero $\Delta H > 0$ and for exothermic reaction the enthalpy change should be lesser than zero $\Delta H < 0$.
Recently Updated Pages
Master Class 11 Computer Science: Engaging Questions & Answers for Success
Master Class 11 Business Studies: Engaging Questions & Answers for Success
Master Class 11 Economics: Engaging Questions & Answers for Success
Master Class 11 English: Engaging Questions & Answers for Success
Master Class 11 Maths: Engaging Questions & Answers for Success
Master Class 11 Biology: Engaging Questions & Answers for Success
Trending doubts
One Metric ton is equal to kg A 10000 B 1000 C 100 class 11 physics CBSE
There are 720 permutations of the digits 1 2 3 4 5 class 11 maths CBSE
Discuss the various forms of bacteria class 11 biology CBSE
Draw a diagram of a plant cell and label at least eight class 11 biology CBSE
State the laws of reflection of light
Explain zero factorial class 11 maths CBSE