


What is sigmoid growth curve? Why is it so called?
Answer
564.9k+ views
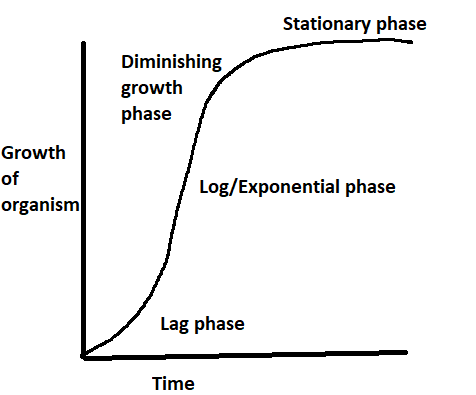
Hint: In their natural world, the growth of living organisms is characterized by an S-shaped curve named as growth is plotted against time, the sigmoid growth curve. This curve is divided into three phases: the lag phase, the log phase or fast growth exponential phase, and the stationary phase.
Complete answer:
A sigmoidal (S-shaped) population growth curve is illustrated by stable populations sharing a defined geographic space. Usually, this curve would follow three main phases, an accelerated period of development, a transitional phase and a plateau phase.
Step of Exponential Growth
Initially, since there are few reproductive individuals who are likely to be broadly spread, population development would be sluggish (lag period). There is a steady growth in population size as numbers accumulate as natality far beats mortality. Mortality is poor because ample energy and negligible resistance to the climate occur.
Transitional Stage
Resources gradually become scarce as the population continues to grow, leading to competition for survival. Natality rates are starting to decrease and death rates are beginning to increase, leading to population growth slowing down.
Plateau Stage
Ultimately, the rising death rate is equal to the birth rate, and population growth is stagnant. With restricting forces holding the population steady, the population has surpassed the carrying capacity of the environment. The population size will not be stable at this stage, but will oscillate around the carrying ability to keep even.
Note: Populations show logistic development when resources are reduced. Population development declines with logistic growth as resources become limited. It falls off when the environment's carrying capacity is exhausted, resulting in an S-shaped curve.
Recently Updated Pages
Master Class 12 Economics: Engaging Questions & Answers for Success
Master Class 12 Physics: Engaging Questions & Answers for Success
Master Class 12 English: Engaging Questions & Answers for Success
Master Class 12 Social Science: Engaging Questions & Answers for Success
Master Class 12 Maths: Engaging Questions & Answers for Success
Master Class 12 Business Studies: Engaging Questions & Answers for Success
Trending doubts
Which are the Top 10 Largest Countries of the World?
What are the major means of transport Explain each class 12 social science CBSE
Draw a labelled sketch of the human eye class 12 physics CBSE
Why cannot DNA pass through cell membranes class 12 biology CBSE
Differentiate between insitu conservation and exsitu class 12 biology CBSE
Draw a neat and well labeled diagram of TS of ovary class 12 biology CBSE