


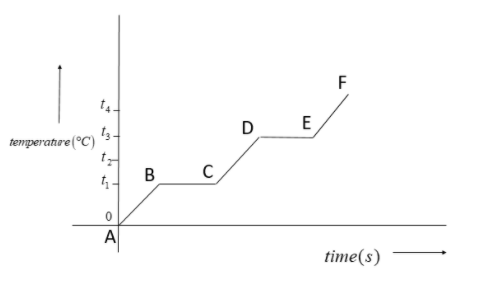
The diagram shows the change of phase of a substance on a temperature-time graph. What is the boiling point of the substance?
a) ${{t}_{1}}{}^\circ C$
b) ${{t}_{2}}{}^\circ C$
c) ${{t}_{3}}{}^\circ C$
d) ${{t}_{4}}{}^\circ C$
Answer
585.3k+ views
Hint: The temperature of a substance always increases with the increase in the surrounding temperature. In case of state change of the material, the temperature of material remains constant with increase in temperature. There are two state changes involved with any material.
Complete answer:
It is well known by all of us that the temperature of a body increases as we apply heat to it. In other words, the temperature of the body increases with the increase in the temperature of the surrounding. But it is also a known fact that as the body undergoes state change, be it from solid to liquid, liquid to gas or vice versa, the temperature of the body remains constant even when we supply heat energy to the body.
There is a very concrete reason to support this fact. The energy we supply to a given body, when the body is undergoing state change, is not utilized to increase its temperature. Rather, this energy is used to undergo state change.
Most of the bodies undergo two basic state changes. These state changes are from solid to liquid and then liquid to gas. When we draw a temperature versus time graph, these state changes will be represented by a horizontal line.
In the given graph, horizontal line BC represents the state change from solid to liquid while the horizontal line DE represents the state change from liquid to gas.
Hence, the boiling point is the point where state changes from liquid to gas. Here this temperature is ${{t}_{3}}{}^\circ C$.
Thus the correct option is (c).
Note:
In a temperature versus time graph the state change of a body is represented by a horizontal line. The first horizontal line will represent state change from solid to liquid, or the melting point. The second one will represent the state change from liquid to gas, or the boiling point.
Recently Updated Pages
Master Class 11 Computer Science: Engaging Questions & Answers for Success
Master Class 11 Business Studies: Engaging Questions & Answers for Success
Master Class 11 Economics: Engaging Questions & Answers for Success
Master Class 11 English: Engaging Questions & Answers for Success
Master Class 11 Maths: Engaging Questions & Answers for Success
Master Class 11 Biology: Engaging Questions & Answers for Success
Trending doubts
One Metric ton is equal to kg A 10000 B 1000 C 100 class 11 physics CBSE
There are 720 permutations of the digits 1 2 3 4 5 class 11 maths CBSE
Discuss the various forms of bacteria class 11 biology CBSE
Draw a diagram of a plant cell and label at least eight class 11 biology CBSE
State the laws of reflection of light
10 examples of friction in our daily life