


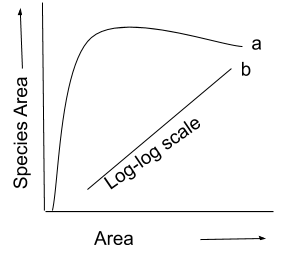
The following graph shows the species -area relationship. Answer the following questions as directed.
(a) Name the naturalist who studied the kind of relationship shown in the graph. Write the observations made by him.
(b) Write the situations as discovered by the ecologists when the value of 'Z' (slope of the line) lies between (i) 0.1 and 0.2 (ii) 0.6 and 1.2. What does 'Z' stand for?
(c) When would the slope of the line 'b' become steeper?
Answer
558.3k+ views
Hint: The relation between the area of a habitat, or part of a habitat, and the number of species found within that area is defined in the species-area relationship or species-area curve. Larger regions tend to include larger numbers of animals, and the relative numbers seem to obey systematic statistical relationships empirically.
Complete answer:
a)The naturalist who investigated the relationship shown in the graph was Alexander Von Humboldt. He found that species richness increased within a region with an increase in the area explored, but only to a maximum.This is expressed by the rectangular hyperbola representing the equation S = CA^Z, where S is the richness of the species, A is the area, C is a constant, and Z is the constant of regression. The logarithmic form of the same equation, which is logS = logC + ZlogA, represents the straight line.
b)When the value of z lies between
(i) z = 0.1 to 0.2: for small or average areas.
(ii) z = 0.6 to 1.2 : for a large area, for example, the entire continent.
Z stands for slope of line.
(c) When very wide areas such as continents are considered for species-area relationships, the slope of the line 'b' becomes steeper.
Note: For islands (or habitats that are otherwise separated from each other, such as woodlots in an agricultural landscape) of different sizes, species-area relationships are also plotted. Although larger islands appear to have more species, a smaller island might have more than a larger one. On the other hand, relationships between species-areas for contiguous ecosystems will often increase as areas increase, given that the sample plots are nested within each other.
Recently Updated Pages
Master Class 12 Economics: Engaging Questions & Answers for Success
Master Class 12 Physics: Engaging Questions & Answers for Success
Master Class 12 English: Engaging Questions & Answers for Success
Master Class 12 Social Science: Engaging Questions & Answers for Success
Master Class 12 Maths: Engaging Questions & Answers for Success
Master Class 12 Business Studies: Engaging Questions & Answers for Success
Trending doubts
Which are the Top 10 Largest Countries of the World?
What are the major means of transport Explain each class 12 social science CBSE
Draw a labelled sketch of the human eye class 12 physics CBSE
Why cannot DNA pass through cell membranes class 12 biology CBSE
Differentiate between insitu conservation and exsitu class 12 biology CBSE
Draw a neat and well labeled diagram of TS of ovary class 12 biology CBSE