The slope of a distance-time graph of a moving body gives its
A. Speed
B. Displacement
C. Velocity
D. Acceleration
Answer
598.8k+ views
Hint: Slope of a graph between two variables $p$ on y-axis and $q$ on x-axis is $\dfrac{{\Delta p}}{{\Delta q}}$. Here $p$ is distance and $q$ is time. Speed is the distance covered by a body divided by the time taken.
Complete answer:
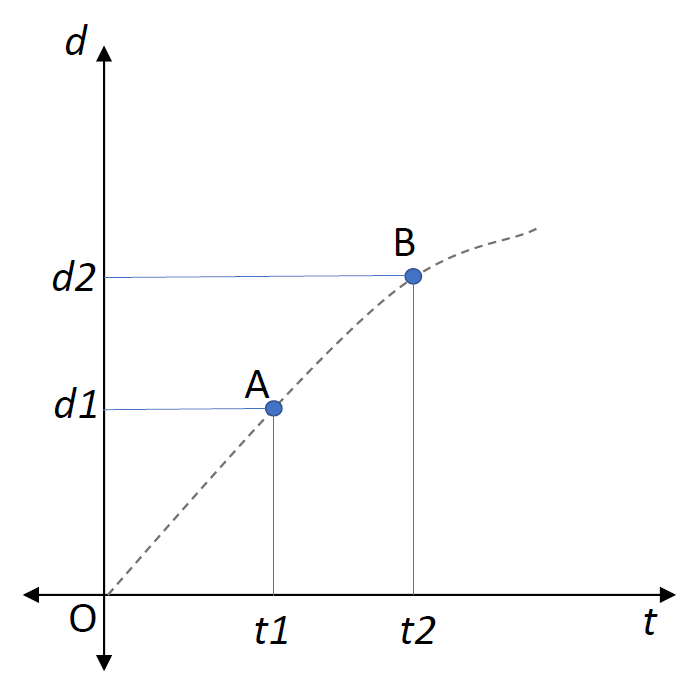
Two physical quantities are plotted on a graph with $d$ as the distance covered by a moving body in time $t$. Consider the graph given below:

Let us consider an object started moving at $t = 0$ and the distance covered is plotted as variable $d$ on y-axis. Above graph shows an example of two points A and B. Let the distance covered when the object reaches A be $d1$ in time $t1$ and distance covered when the object reaches B be $d2$ in time $t2$. Slope of the line joining these two points is given as $ = \dfrac{{d2 - d1}}{{t2 - t1}}$, which is equal to the average speed of the object between A and B. When comparing the other choices, we know that A is correct. Other choices are displacement, velocity and acceleration which can be unchecked as correct options because each of these quantities requires direction which is not possible in distance-time graphs.
Note: We mentioned averaged speed because distance covered may be distributed through the time between A and B. Here we gave a simple example of a straight line. But actually, the line may not be straight in most of the cases.
Complete answer:
Two physical quantities are plotted on a graph with $d$ as the distance covered by a moving body in time $t$. Consider the graph given below:

Let us consider an object started moving at $t = 0$ and the distance covered is plotted as variable $d$ on y-axis. Above graph shows an example of two points A and B. Let the distance covered when the object reaches A be $d1$ in time $t1$ and distance covered when the object reaches B be $d2$ in time $t2$. Slope of the line joining these two points is given as $ = \dfrac{{d2 - d1}}{{t2 - t1}}$, which is equal to the average speed of the object between A and B. When comparing the other choices, we know that A is correct. Other choices are displacement, velocity and acceleration which can be unchecked as correct options because each of these quantities requires direction which is not possible in distance-time graphs.
Note: We mentioned averaged speed because distance covered may be distributed through the time between A and B. Here we gave a simple example of a straight line. But actually, the line may not be straight in most of the cases.
Recently Updated Pages
Master Class 9 General Knowledge: Engaging Questions & Answers for Success

Master Class 9 Social Science: Engaging Questions & Answers for Success

Master Class 9 English: Engaging Questions & Answers for Success

Master Class 9 Maths: Engaging Questions & Answers for Success

Master Class 9 Science: Engaging Questions & Answers for Success

Class 9 Question and Answer - Your Ultimate Solutions Guide

Trending doubts
Difference Between Plant Cell and Animal Cell

Fill the blanks with the suitable prepositions 1 The class 9 english CBSE

Who is eligible for RTE class 9 social science CBSE

Which places in India experience sunrise first and class 9 social science CBSE

What is pollution? How many types of pollution? Define it

Name 10 Living and Non living things class 9 biology CBSE


