What is a logarithmic model?
Answer
531.9k+ views
Hint: We will first define what a logarithmic model is. Then we will explain the conditions, when and where it is used. We will also consider an example of logarithmic function and plot its graph to understand it better.
Complete step-by-step answer:
We will start the question. We know that a logarithmic model is a mathematical model which is used to measure the magnitude of the thing that is being measured using the model.
When we plot a logarithmic model, we can see that it increases rapidly at the beginning and then it is followed by a period of slowing growth. We must note that the growth of the model or function is without a bound. Thus, we can say that logarithmic models are not used when there is an upper bound condition.
We generally use the logarithmic functions when the entity that we are trying to measure the magnitude of can go from extremely small to extremely large.
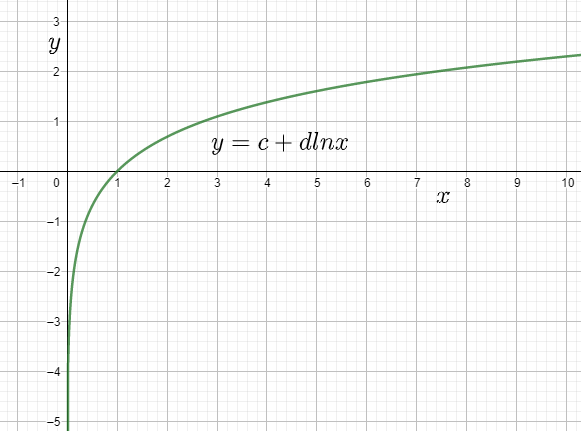
If we consider a logarithmic function y = c + d ln x and plot the function in the graph, we get it as below.

We can see that the function exhibits a few properties like the graph increases towards the right without a bound. Also, the value of d controls the rate of growth of the function. Logarithmic functions have multiple applications throughout the field of Mathematics and Physics.
Note: We should not get confused between the Logarithmic model and Exponential model. We must know that an exponential model has growth which starts very slow and then increases extremely fast as the time increases. Here, we can see that the rate of increase is proportional to current value whereas for a logarithmic function the rate of increase is inversely proportional to its current value. Hence it increases rapidly in the beginning when the value itself is low and slowly the rate of increase reduces as the value becomes extremely large.
Complete step-by-step answer:
We will start the question. We know that a logarithmic model is a mathematical model which is used to measure the magnitude of the thing that is being measured using the model.
When we plot a logarithmic model, we can see that it increases rapidly at the beginning and then it is followed by a period of slowing growth. We must note that the growth of the model or function is without a bound. Thus, we can say that logarithmic models are not used when there is an upper bound condition.
We generally use the logarithmic functions when the entity that we are trying to measure the magnitude of can go from extremely small to extremely large.
If we consider a logarithmic function y = c + d ln x and plot the function in the graph, we get it as below.

We can see that the function exhibits a few properties like the graph increases towards the right without a bound. Also, the value of d controls the rate of growth of the function. Logarithmic functions have multiple applications throughout the field of Mathematics and Physics.
Note: We should not get confused between the Logarithmic model and Exponential model. We must know that an exponential model has growth which starts very slow and then increases extremely fast as the time increases. Here, we can see that the rate of increase is proportional to current value whereas for a logarithmic function the rate of increase is inversely proportional to its current value. Hence it increases rapidly in the beginning when the value itself is low and slowly the rate of increase reduces as the value becomes extremely large.
Recently Updated Pages
Master Class 10 Computer Science: Engaging Questions & Answers for Success

Master Class 10 General Knowledge: Engaging Questions & Answers for Success

Master Class 10 English: Engaging Questions & Answers for Success

Master Class 10 Social Science: Engaging Questions & Answers for Success

Master Class 10 Maths: Engaging Questions & Answers for Success

Master Class 10 Science: Engaging Questions & Answers for Success

Trending doubts
What is the median of the first 10 natural numbers class 10 maths CBSE

Which women's tennis player has 24 Grand Slam singles titles?

Who is the Brand Ambassador of Incredible India?

Why is there a time difference of about 5 hours between class 10 social science CBSE

Write a letter to the principal requesting him to grant class 10 english CBSE

A moving boat is observed from the top of a 150 m high class 10 maths CBSE


