


Which of the following graphs are correct for zero – order reaction?
A.
B.
C.
D.
Answer
567k+ views
Hint: Zero order reaction: a chemical reaction in which the rate of reaction is constant and independent of the concentration of the reacting substances. Zero-order reaction is a chemical reaction wherein the rate does not vary with the increase or decrease in the concentration of the reactants. Therefore, the rate of these reactions is always equal to the rate constant of the specific reactions (since the rate of these reactions is proportional to the zeroth power of reactants concentration)
Complete Step By Step Solution:
The Haber process produces ammonia from hydrogen and nitrogen gas. The reverse of this process (the decomposition of ammonia to form nitrogen and hydrogen) is a zero-order reaction.
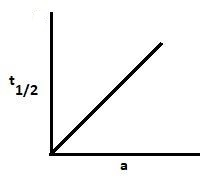
For a zero-order reaction, $t_\dfrac{1}{2} = \dfrac{{{{\left[ A \right]}_0}}}{{2k}}$. Thus, as the initial concentration increases, the half-life increases. Hence, graph A is correct.
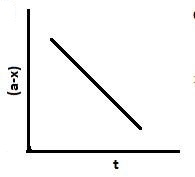
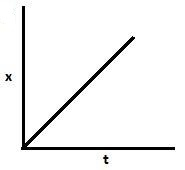
Also, $\left[ {{A_o}} \right] - \left[ A \right] = kt.$. Hence, with an increase in time, x increases and $a - x$ decreases. So graph B and C are also correct.
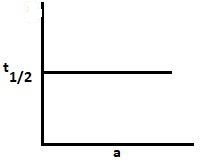
For the first-order reaction, the half-life period is independent of the concentration. Hence, graph D is for the first-order reaction.
Hence, graph A,B and C are correct for zero order reaction.
Note: The rate law for a zero-order reaction is rate = k, where k is the rate constant. In the case of a zero-order reaction, the rate constant k will have units of concentration/time, such as M/s. For a zero order reaction, as shown in the following figure, the plot of [A] versus time is a straight line with k = - slope of the line. Other graphs are curved for a zero order reaction.
Complete Step By Step Solution:
The Haber process produces ammonia from hydrogen and nitrogen gas. The reverse of this process (the decomposition of ammonia to form nitrogen and hydrogen) is a zero-order reaction.
For a zero-order reaction, $t_\dfrac{1}{2} = \dfrac{{{{\left[ A \right]}_0}}}{{2k}}$. Thus, as the initial concentration increases, the half-life increases. Hence, graph A is correct.
Also, $\left[ {{A_o}} \right] - \left[ A \right] = kt.$. Hence, with an increase in time, x increases and $a - x$ decreases. So graph B and C are also correct.
For the first-order reaction, the half-life period is independent of the concentration. Hence, graph D is for the first-order reaction.
Hence, graph A,B and C are correct for zero order reaction.
Note: The rate law for a zero-order reaction is rate = k, where k is the rate constant. In the case of a zero-order reaction, the rate constant k will have units of concentration/time, such as M/s. For a zero order reaction, as shown in the following figure, the plot of [A] versus time is a straight line with k = - slope of the line. Other graphs are curved for a zero order reaction.
Recently Updated Pages
Master Class 12 Economics: Engaging Questions & Answers for Success
Master Class 12 Physics: Engaging Questions & Answers for Success
Master Class 12 English: Engaging Questions & Answers for Success
Master Class 12 Social Science: Engaging Questions & Answers for Success
Master Class 12 Maths: Engaging Questions & Answers for Success
Master Class 12 Business Studies: Engaging Questions & Answers for Success
Trending doubts
Which are the Top 10 Largest Countries of the World?
What are the major means of transport Explain each class 12 social science CBSE
Draw a labelled sketch of the human eye class 12 physics CBSE
What is a transformer Explain the principle construction class 12 physics CBSE
Why cannot DNA pass through cell membranes class 12 biology CBSE
Differentiate between insitu conservation and exsitu class 12 biology CBSE