
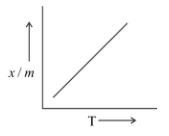
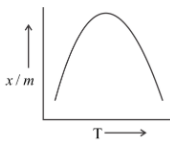
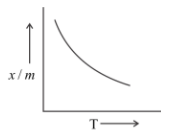
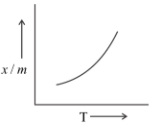
Which of the plots is adsorption isobar for chemisorption?
A)
B)
C)
D)


Answer
588k+ views
Hint: Adsorption isobar is a graph between the amount absorbed $\left( {\dfrac{x}{m}} \right)$ and the temperature (T) of the ascorbate at constant pressure. Absorptivity decreases with increase in temperature because the forces of attraction between the two become weaker.
Complete answer:
Chemisorption requires high activation energy, so it is referred to as activated absorption.
In chemisorption, adsorption first increases and then decreases with temperature. The initial increase is due to the heat supplied which acts as activation every required in chemisorption. But later it decreases due to the isothermic nature of adsorption.
Therefore, we can predict the nature of the graph as:
At low temperature, $\dfrac{x}{m}$ should be small.
Initially, the amount of gas adsorbed increases with rising in temperature and it will also increase the energy of molecules already adsorbed.
As a direct consequence of this, the extent of absorption starts to decrease.
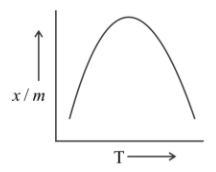
Hence, we may conclude that the correct answer is option (B).
Note: The chemical absorption is slow at low temperature and it occurs at a higher rate with increase in temperature. The adsorption Isobar can be used to distinguish between physical and chemical absorption. In physical absorption, there is a regular decrease as temperature increases.
Complete answer:
Chemisorption requires high activation energy, so it is referred to as activated absorption.
In chemisorption, adsorption first increases and then decreases with temperature. The initial increase is due to the heat supplied which acts as activation every required in chemisorption. But later it decreases due to the isothermic nature of adsorption.
Therefore, we can predict the nature of the graph as:
At low temperature, $\dfrac{x}{m}$ should be small.
Initially, the amount of gas adsorbed increases with rising in temperature and it will also increase the energy of molecules already adsorbed.
As a direct consequence of this, the extent of absorption starts to decrease.

Hence, we may conclude that the correct answer is option (B).
Note: The chemical absorption is slow at low temperature and it occurs at a higher rate with increase in temperature. The adsorption Isobar can be used to distinguish between physical and chemical absorption. In physical absorption, there is a regular decrease as temperature increases.
Recently Updated Pages
Master Class 12 Economics: Engaging Questions & Answers for Success

Master Class 12 Physics: Engaging Questions & Answers for Success

Master Class 12 English: Engaging Questions & Answers for Success

Master Class 12 Social Science: Engaging Questions & Answers for Success

Master Class 12 Maths: Engaging Questions & Answers for Success

Master Class 12 Business Studies: Engaging Questions & Answers for Success

Trending doubts
Which are the Top 10 Largest Countries of the World?

What are the major means of transport Explain each class 12 social science CBSE

Draw a labelled sketch of the human eye class 12 physics CBSE

Why cannot DNA pass through cell membranes class 12 biology CBSE

Differentiate between insitu conservation and exsitu class 12 biology CBSE

Draw a neat and well labeled diagram of TS of ovary class 12 biology CBSE


