


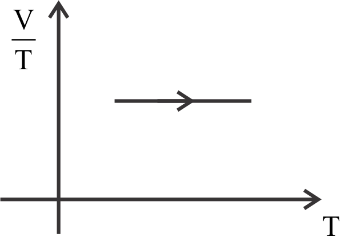
For an isobaric process on an ideal gas, which of the following graphs is correct?
(1)
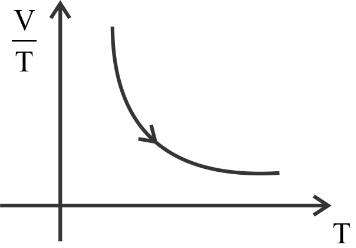
(2)
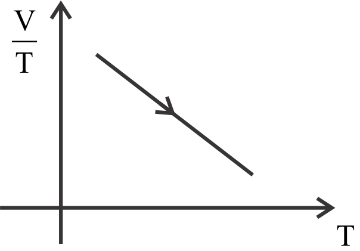
(3)
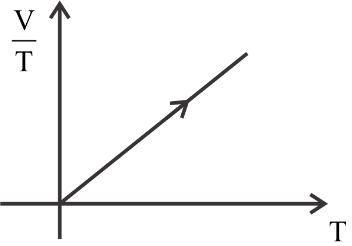
(4)
Answer
232.8k+ views
Hint Four graphs in which the temperature is plotted against the ratio of volume to temperature is given. We have to find the graph which represents the isobaric process. To find the graph which represents isobaric processes we should have knowledge about the isobaric process and also about other thermodynamic processes to differentiate isobaric processes from other processes.
Complete step by step answer
There are different types of thermodynamic processes.
A process in which the temperature of the system is maintained throughout is called an isothermal process
In isobaric processes the pressure is maintained constant while in isochoric processes the volume is maintained constant.
If the system is insulated from the surroundings then no heat flows between the system and the surroundings and this process is adiabatic process
In the given problem the first process is an isochoric process because the volume is constant in the first process.
In the given graphs the temperature is plotted against the ratio of volume to temperature
It is an isobaric process, in isobaric process the volume is directly proportional to the temperature
$ \Rightarrow V \propto T$
$ \Rightarrow \dfrac{V}{T} \propto {\text{constant}}$
So the graph must be constant.
Let us analyse the given graphs,
The first is constant, the second graph is a curve, the third graph is decreasing constantly, and the fourth graph is increasing constantly.
In the isobaric process the ratio of volume to temperature is constant, it is neither increasing constantly nor decreasing constantly, and it is just constant and does not change.
So we can see clearly that graph 1 represents the isobaric process.
Hence the correct answer is option 1 (1st graph)
Note In the isobaric process the pressure is maintained constant by allowing the volume to expand or contract to neutralize the pressure change if any caused by heat transfer. If the system expands then the system does positive work, if the system contracts then it does negative work.
Recently Updated Pages
JEE Main 2023 April 6 Shift 1 Question Paper with Answer Key
JEE Main 2023 April 6 Shift 2 Question Paper with Answer Key
JEE Main 2023 (January 31 Evening Shift) Question Paper with Solutions [PDF]
JEE Main 2023 January 30 Shift 2 Question Paper with Answer Key
JEE Main 2023 January 25 Shift 1 Question Paper with Answer Key
JEE Main 2023 January 24 Shift 2 Question Paper with Answer Key
Trending doubts
JEE Main 2026: Session 2 Registration Open, City Intimation Slip, Exam Dates, Syllabus & Eligibility
JEE Main 2026 Application Login: Direct Link, Registration, Form Fill, and Steps
Understanding the Angle of Deviation in a Prism
Hybridisation in Chemistry – Concept, Types & Applications
How to Convert a Galvanometer into an Ammeter or Voltmeter
Understanding Uniform Acceleration in Physics
Other Pages
JEE Advanced Marks vs Ranks 2025: Understanding Category-wise Qualifying Marks and Previous Year Cut-offs
Laws of Motion Class 11 Physics Chapter 4 CBSE Notes - 2025-26
Waves Class 11 Physics Chapter 14 CBSE Notes - 2025-26
Mechanical Properties of Fluids Class 11 Physics Chapter 9 CBSE Notes - 2025-26
Thermodynamics Class 11 Physics Chapter 11 CBSE Notes - 2025-26
Units And Measurements Class 11 Physics Chapter 1 CBSE Notes - 2025-26