Data Handling - Exercise-wise Questions and Answers For Class 8 Maths - Free PDF Download
FAQs on NCERT Solutions For Class 8 Maths Chapter 4 Data Handling (2025-26)
1. How are NCERT Solutions for Class 8 Maths Chapter 4 structured as per CBSE guidelines?
NCERT Solutions for Class 8 Maths Chapter 4 Data Handling follow a step-by-step problem-solving approach with detailed explanations as per CBSE 2025–26 requirements. Each question in the textbook is solved with logical steps, using official methods for graph construction, measure calculation (mean, median, mode), and probability. Every solution ensures clarity, correct reasoning, and matches marks allocation per CBSE standards.
2. What is the correct method to solve bar graph questions in NCERT Solutions for Class 8 Maths Chapter 4?
To solve bar graph questions in Chapter 4 Data Handling, you should:
- Read what the axes represent (categories vs. frequency/values)
- Use correct units and spacing between bars
- Label bars and both axes clearly
- Interpret heights to answer related questions
- Always reference the data range and frequency before making conclusions
3. How do NCERT Solutions for Class 8 Maths Chapter 4 explain probability with class-appropriate examples?
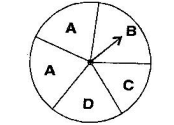
The solutions use examples like tossing coins, drawing slips, spinning wheels, and explain probability as Probability = (Number of favourable outcomes) / (Total number of outcomes). All probabilities are shown to lie between 0 and 1, with each experiment explained using everyday objects to make abstract concepts relatable.
4. What are the main types of graphical representation taught in Chapter 4 Data Handling?
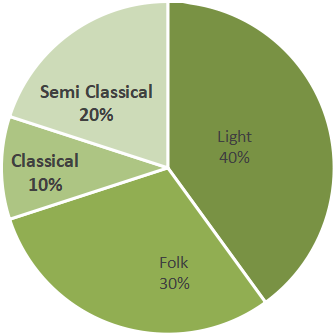
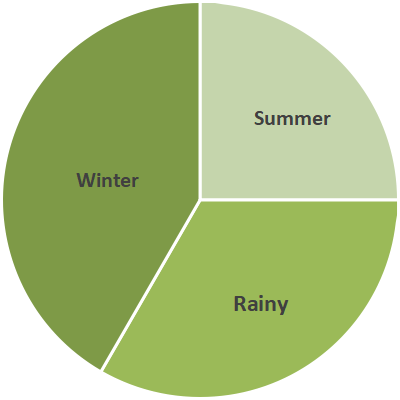
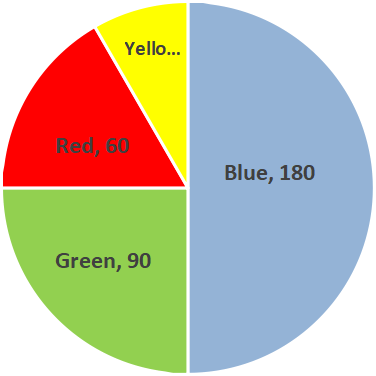
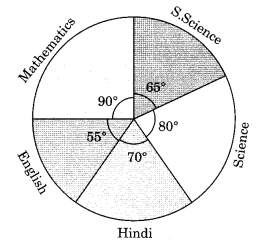
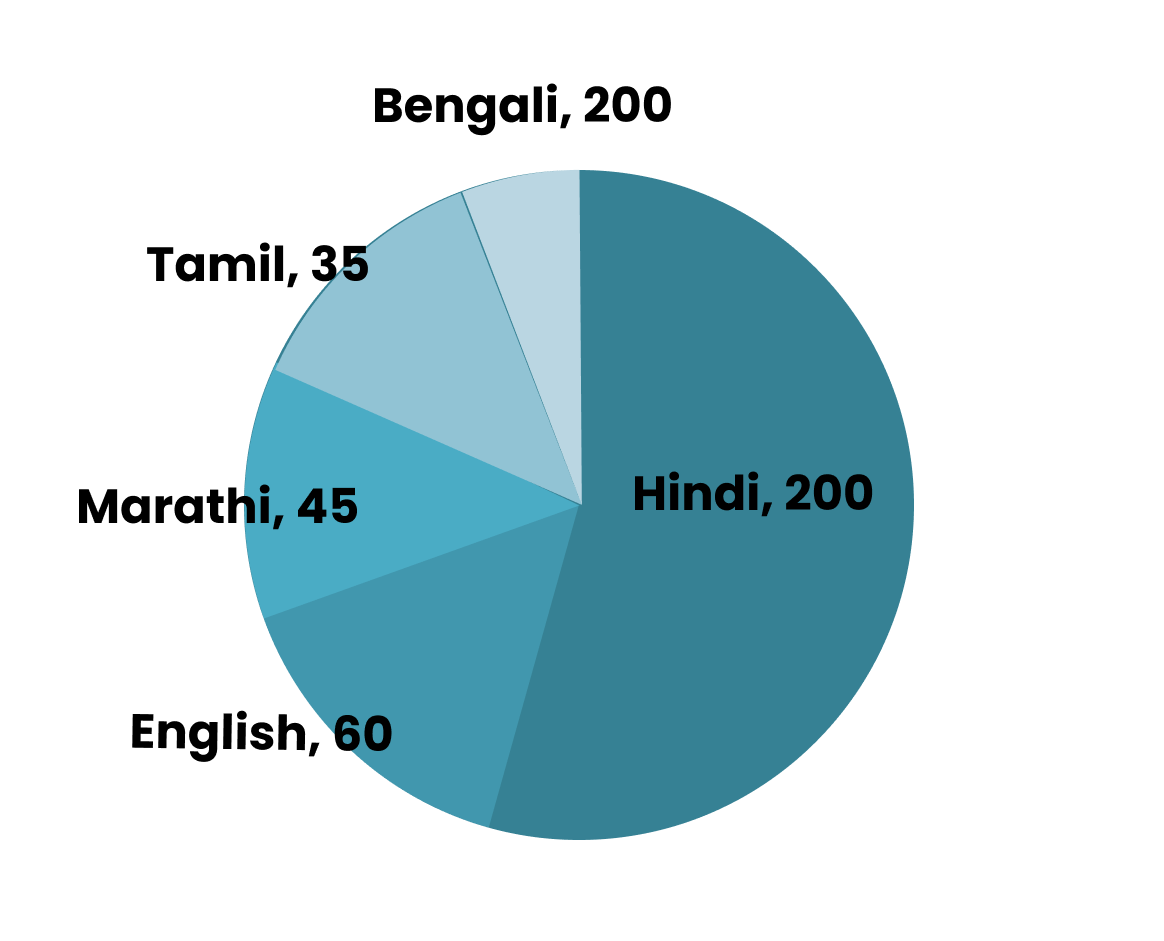
Chapter 4 focuses on bar graphs (single and double), histograms (for grouped data), and pie charts (circle graphs). NCERT Solutions guide students stepwise on how to construct, label, and interpret each type, following CBSE methodology for accurate representation and analysis.
5. How do NCERT Solutions help students to avoid common mistakes in Data Handling problems?
Solutions highlight mistakes such as incorrectly grouping data, mislabeling axes, confusion between raw and organised data, and miscalculating central angles or probabilities. Each answer includes tips or warning notes, ensuring students understand requirements and avoid errors that lead to mark loss in exams.
6. What approach should be used for solving mean, median, and mode questions in the exercises for Chapter 4?
The method includes:
- Mean: Add all observations, divide by the total number
- Median: Arrange in ascending order, find central value(s)
- Mode: Identify the value with highest frequency
7. In Chapter 4, how does one differentiate between raw data and organized data as per NCERT Solutions?
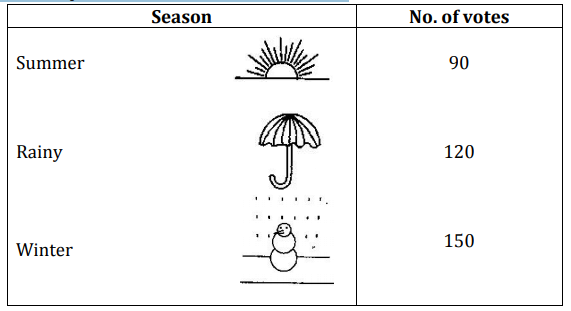
Raw data refers to unorganized information as collected; organized data means arranging data into tables, groups, or using tally marks, enabling analysis. NCERT Solutions teach systematic arrangement, as required before graphical representation or calculation.
8. Why is it necessary to convert primary data to a more organised form before drawing graphs, as discussed in Class 8 Maths Chapter 4?
Converting primary (raw) data to an organised form (tables, grouped data) makes it possible to accurately represent information with graphs. This step reduces errors, helps in identifying patterns, and ensures that subsequent interpretation and calculation are meaningful, as explained in CBSE NCERT solutions.
9. What key skills do students develop by practising NCERT Solutions for Class 8 Maths Chapter 4 Data Handling?
By practising these solutions, students learn to:
- Collect and organise data systematically
- Draw and interpret various graphs
- Calculate central tendency (mean, median, mode)
- Understand and apply probability in daily scenarios
- Draw logical conclusions from statistical data
10. How do NCERT Solutions for Data Handling ensure students prepare for CBSE board exams effectively?
The NCERT Solutions are structured as per the CBSE 2025–26 syllabus and pattern. They include model answers, alternative approaches where needed, and solved examples similar to those in previous board exams. This familiarity with question types and solution methods helps maximize student confidence and performance in the exam.
11. What is the difference between a bar graph and a histogram according to Class 8 Data Handling NCERT Solutions?
A bar graph represents categorical data using bars with gaps in between, while a histogram displays grouped numerical data with no gaps, showing class intervals on the horizontal axis and frequency on the vertical. NCERT Solutions explain when to use each and how to construct them properly.
12. How do students verify if their calculated central angles for a pie chart are correct, as per NCERT guidelines?
NCERT Solutions recommend:
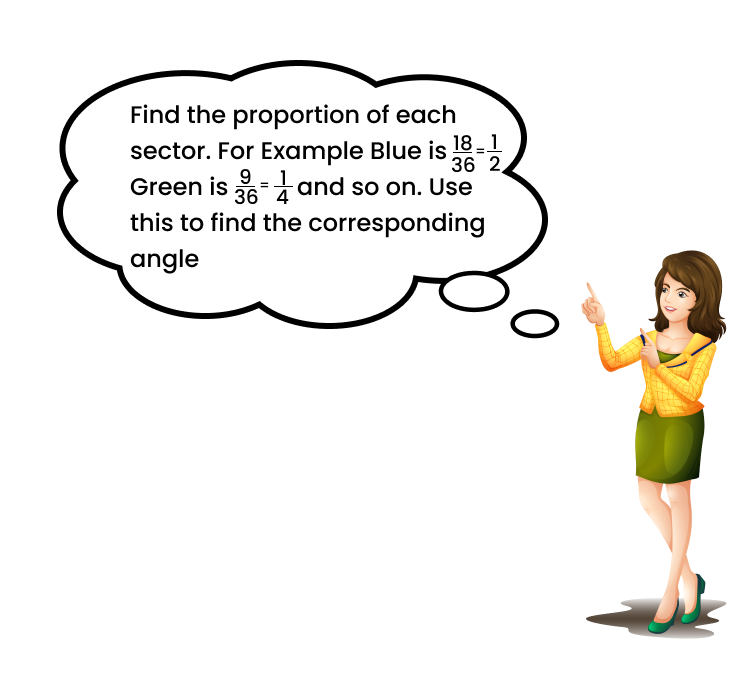
- Calculate each sector's central angle using the formula: (Value of item / Total value) × 360°
- Add all calculated angles—they should sum to exactly 360°
- Check for calculation slips before drawing
13. What are some higher-order thinking questions (HOTS) students may encounter in NCERT Solutions for Data Handling?
HOTS may include:
- Comparing data sets to spot trends or anomalies
- Explaining why a particular graph (e.g., histogram vs. pie chart) best represents data
- Predicting outcomes if data is grouped differently
- Analysing the impact of misrepresenting scales on interpretation
14. In what ways can central tendency (mean, median, mode) mislead data interpretation, and how do NCERT Solutions address this?
Solutions caution that:
- Mean can be affected by outliers/extreme values
- Mode may not represent the dataset if multiple modes/small data
- Median doesn't reflect actual data values in all cases
15. What should students focus on while solving probability questions in Class 8 Maths Chapter 4 NCERT Solutions for maximum accuracy?
Key points include:
- Correctly identifying total possible outcomes
- Listing all favourable outcomes distinctly
- Writing probability as a simplified fraction between 0 and 1
- Making no assumptions unless justified by data


