


How do you graph the equation \[x = 2y - {y^2}\] ?
Answer
556.5k+ views
Hint: To solve this we need to give the values of ‘x’ and we can find the values of ‘y’. Otherwise we can find the coordinate of the given equation lying on the line of x- axis, we can find this by substituting the value of ‘y’ is equal to zero (x-intercept). Similarly we can find the coordinate of the equation lying on the line of y- axis, we can find this by substituting the value of ‘x’ equal to zero (y-intercept).
Complete step-by-step answer:
Given, \[x = 2y - {y^2}\] .
To find the x-intercept. That is the value of ‘x’ at \[y = 0\] . Substituting this in the given equation. We have,
\[x = 2(0) - {(0)^2}\]
\[x = 0\]
The coordinate is \[(0,0)\] .
To find the y-intercept. That is the value of ‘y’ at \[x = 0\] . Substituting this in the given equation we have,
\[0 = 2y - {y^2}\]
Rearranging the terms and taking common we have,
\[y(2 - y) = 0\] .
\[y = 0\] or \[y = 2\]
We choose \[y = 2\] . If we take \[y = 0\] the coordinate point will be in origin only.
Thus we have a coordinate of the equation which lies on the line of the y-axis. The coordinate is \[(0,2)\] .
Since the x-intercept is zero we need to find more coordinates.
Let put \[x = 1\] in the given equation we have
\[1 = 2y - {y^2}\]
Rearranging we have,
\[{y^2} - 2y + 1 = 0\]
This is in the form \[{(a - b)^2} = {a^2} + {b^2} - 2ab\] . Thus we have
\[{(y - 1)^2} = 0\]
\[y = 1\] .
(Although 1 is repeated twice we take only one value)
The coordinates are \[(1,1)\]
Now let’s take \[x = - 3\] . Substitute in the given problem we have,
\[ - 3 = 2y - {y^2}\]
Rearranging we have,
\[{y^2} - 2y - 3 = 0\]
Expanding the middle term
\[{y^2} - 3y + y - 3 = 0\]
\[y(y - 3) + 1(y - 3) = 0\]
\[(y - 3)(y + 1) = 0\]
Thus we have \[y = 3\] and \[y = - 1\] .
Thus the coordinates are \[( - 3,3)\] and \[( - 3, - 1)\] .
Hence we have the coordinates \[(1,1)\] , \[( - 3,3)\] and \[( - 3, - 1)\] .
Now plotting the graph we have,
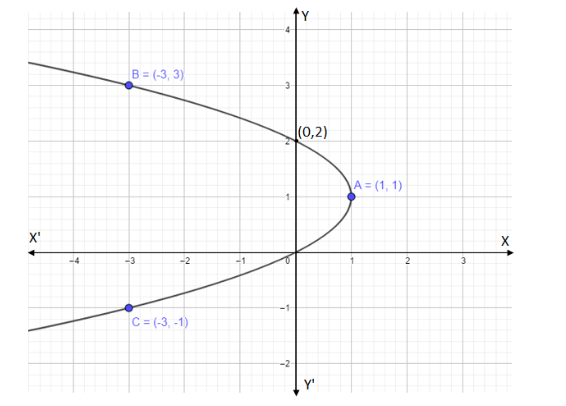
Note: In above we have x-intercept is zero. So we need to find more coordinates to plot the graph. After finding the coordinates \[(0,2)\] and \[(1,1)\] , we know that it is tending in the direction of the negative x- axis. Hence we take \[x = - 3\] to find the next coordinate (if we take -1 or -2 we will get fractions). A graph shows the relation between two variable quantities, it contains two axes perpendicular to each other namely the x-axis and the y-axis. Each variable is measured along one of the axes. In the question, we are given one linear equation containing two variables namely x and y, x is measured along the x-axis and y is measured along the y-axis while tracing the given equations.
Complete step-by-step answer:
Given, \[x = 2y - {y^2}\] .
To find the x-intercept. That is the value of ‘x’ at \[y = 0\] . Substituting this in the given equation. We have,
\[x = 2(0) - {(0)^2}\]
\[x = 0\]
The coordinate is \[(0,0)\] .
To find the y-intercept. That is the value of ‘y’ at \[x = 0\] . Substituting this in the given equation we have,
\[0 = 2y - {y^2}\]
Rearranging the terms and taking common we have,
\[y(2 - y) = 0\] .
\[y = 0\] or \[y = 2\]
We choose \[y = 2\] . If we take \[y = 0\] the coordinate point will be in origin only.
Thus we have a coordinate of the equation which lies on the line of the y-axis. The coordinate is \[(0,2)\] .
Since the x-intercept is zero we need to find more coordinates.
Let put \[x = 1\] in the given equation we have
\[1 = 2y - {y^2}\]
Rearranging we have,
\[{y^2} - 2y + 1 = 0\]
This is in the form \[{(a - b)^2} = {a^2} + {b^2} - 2ab\] . Thus we have
\[{(y - 1)^2} = 0\]
\[y = 1\] .
(Although 1 is repeated twice we take only one value)
The coordinates are \[(1,1)\]
Now let’s take \[x = - 3\] . Substitute in the given problem we have,
\[ - 3 = 2y - {y^2}\]
Rearranging we have,
\[{y^2} - 2y - 3 = 0\]
Expanding the middle term
\[{y^2} - 3y + y - 3 = 0\]
\[y(y - 3) + 1(y - 3) = 0\]
\[(y - 3)(y + 1) = 0\]
Thus we have \[y = 3\] and \[y = - 1\] .
Thus the coordinates are \[( - 3,3)\] and \[( - 3, - 1)\] .
Hence we have the coordinates \[(1,1)\] , \[( - 3,3)\] and \[( - 3, - 1)\] .
Now plotting the graph we have,
Note: In above we have x-intercept is zero. So we need to find more coordinates to plot the graph. After finding the coordinates \[(0,2)\] and \[(1,1)\] , we know that it is tending in the direction of the negative x- axis. Hence we take \[x = - 3\] to find the next coordinate (if we take -1 or -2 we will get fractions). A graph shows the relation between two variable quantities, it contains two axes perpendicular to each other namely the x-axis and the y-axis. Each variable is measured along one of the axes. In the question, we are given one linear equation containing two variables namely x and y, x is measured along the x-axis and y is measured along the y-axis while tracing the given equations.
Recently Updated Pages
Master Class 9 General Knowledge: Engaging Questions & Answers for Success
Master Class 9 Social Science: Engaging Questions & Answers for Success
Master Class 9 English: Engaging Questions & Answers for Success
Master Class 9 Maths: Engaging Questions & Answers for Success
Master Class 9 Science: Engaging Questions & Answers for Success
Class 9 Question and Answer - Your Ultimate Solutions Guide
Trending doubts
Difference Between Plant Cell and Animal Cell
Fill the blanks with the suitable prepositions 1 The class 9 english CBSE
Who is eligible for RTE class 9 social science CBSE
Which places in India experience sunrise first and class 9 social science CBSE
What is pollution? How many types of pollution? Define it
Name 10 Living and Non living things class 9 biology CBSE